
Figure 3.
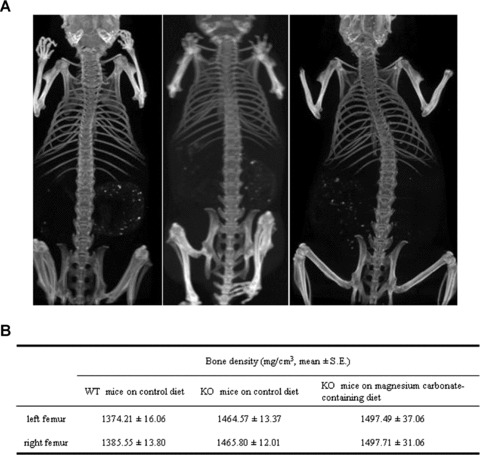
Evaluation of bone integrity in mice treated with magnesium carbonate‐containing diet. (A) 2‐Di‐mensional images of computerized axial tomography (CAT) scan from a WT mouse on control diet (left); KO mouse on control diet (center); and KO mouse on magnesium carbonate‐enriched diet (right) for 5 months; all mice are imaged at the age of 6 months. (B) Bone density assays of the groups of mice represented in A. The values in KO mice on control diet are not statistically different from the WT mice on control diet or from KO mice on magnesium carbonate‐containing diet.