The Process of cellular uptake and metabolism of cyclosporine (CsA) is poorly understood. Previously, we have shown that the transport of CsA in blood occurs in association with plasma lipoproteins,1 with low-density lipoprotein (LDL), and with high-density lipoprotein, each transporting about 32% of the total amount of CsA in blood. This observation raises the possibility that further cellular metabolism of CsA, at least in part, may take place in conjunction with LDL metabolism through its specific, high-affinity cell surface receptor. In this report, we present results of studies that indicate that (1) [3H]-labeled CsA is taken up, in an apparently specific manner, by peripheral blood lymphocytes (PBL) when incubated with the [3H] CsA–LDL complex; and (2) cellular uptake of [3H] CsA is enhanced when PBL, whether freshly isolated or stimulated with phytohemagglutinin (PHA), are incubated in a medium containing both [3H] CsA and FK-506 (FK) in a 1:1 (wt/wt) proportion.
Materials and Methods
Tritiated dihydrocyclosporine A (60 mCi/mmol) and CsA standards were obtained from Sandoz, Ltd (Basel, Switzerland) as ethanolic solutions. FK was a gift from Fujisawa Pharmaceutical Co, Ltd (Osaka, Japan). Methanolic solution of FK was used in the experiments. Culture media and antibiotics were obtained from GIBCO (Grand Island, NY). All other reagents and supplies were from Fisher Scientific Co, Pittsburgh.
Lipoproteins
Human LDL (d, 1.019 to 1.063) was prepared from blood collected in 0.1% EDTA from healthy subjects who had fasted overnight. Lipoproteins were fractionated by sequential floatation in a Beckman preparative ultracentrifuge (Beckman Instruments, Inc, Fullerton, CA) according to Havel et al.2 Protein determinations were performed by the Bradford method.3
Cells
Peripheral blood mononuclear cells were isolated as previously described4 from approximately 100 mL of blood obtained from healthy volunteers for each experiment. The monocyte content of these cells was depleted by the method of Jerrells et al.5 Cell viability was assessed by using the dye exclusion method.6
PHA-Induced Activation of PBL
Lymphocyte cultures were set up in 24-well cluster plates (5 × 10⁵ cells/well) in 1 mL of tissue culture medium supplemented with 10% human serum, 20% interleukin-2, and PHA (0.0125 μg/mL). After 96 hours, the cells were harvested and washed twice and the cell concentration determined.
Alloreactive T cell clones were generated from mixed lymphocyte cultures. The uptake of CsA by these cells in various experiments was determined as described in the following sections.
Lipoprotein-CsA Complex
LDL (100 μg in 1 mL RPMI 1640 medium) was added dropwise with stirring to an ethanolic [3H] CsA solution (50 μL). The mixture was incubated with constant shaking for one hour at room temperature. The specific activity of the [3H] CsA–LDL complex thus obtained in three separate preparations was 20 ± 0.8 × 10⁴ dpm/μg LDL. The purity of LDL was assessed by sodium dodecyl sulfate gel electrophoresis.
CsA Uptake by PBL
Lymphocytes were incubated in RPMI 1640 medium containing 1% bovine serum albumin (BSA) in the presence or absence of CsA and/or FK for 24 hours. After these preincubations, the cells were washed twice with ice-cold 0.85% NaCl solution and then resuspended in 1% BSA-RPMI medium. The cells were placed in culture wells (approximately 106 cells/well) and exposed to increasing molar concentrations of [3H] CsA (specific activity, 900 to 1,100 dpm/pmol) and equivalent concentrations of cold CsA and FK, as indicated in the legends to the figures, for one hour at 37°C in the humidified atmosphere of 95% O2:5% CO2. Transport flux was stopped by adding ice-cold saline and cooling the mixture further for ten minutes over ice. The cells were washed three times with cold saline and incubated in 0.2 mL 1 N KOH for one hour at 70°C. The digested solution was used for the measurement of radioactivity and protein determinations.
The cell content of FK was measured by an enzyme immunoassay method obtained from Fujisawa.
In experiments when the [3H] CsA–LDL complex was used, the results are expressed as picomoles of CsA accumulated per milligram cell protein as a function of micrograms of LDL protein and the corresponding amount of [3H] CsA contained in the [3H] CsA–LDL complex. Nonspecific (receptor-independent) binding of LDL to the cells in these experiments was determined by incubating the cells in the presence of 100-fold excess of cold LDL as well as cold CsA.
Results
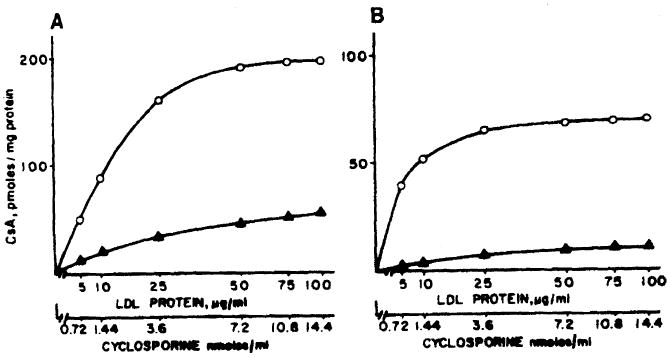
CsA uptake by lymphocytes from two healthy donors was studied by incubating cells with the [3H] CsA–LDL complex. The kinetics of the uptake of CsA in these experiments are shown in Fig 1, panels A and B. In both individuals studied, the CsA uptake appears to reach saturation at an LDL concentration of about 50 μg/mL medium. The corresponding CsA concentration is about 900 ng/mL. In a previous study4 on the cell surface binding and subsequent metabolism of LDL by T and B lymphocytes, we have observed that the LDL receptor is saturated at 50 μg LDL/mL medium. Moreover, [3H] CsA uptake by lymphocytes was suppressed in the presence of cold CsA and LDL. Combined, these observations suggest that internalization of lipoprotein-associated CsA may occur via the high-affinity specific receptor for LDL on the cell surface. The experimental conditions used in these studies imply that the CsA measurements shown reflect both the processes of cell surface binding and internalization.
Fig 1.

Cellular uptake of CsA in PBL incubated with the [3H] CsA–LDL complex for one hour. The open and closed symbols represent the total and nonspecific (LDL receptor-independent) uptake of [3H] CsA, respectively. Panels A and B are results in two subjects.
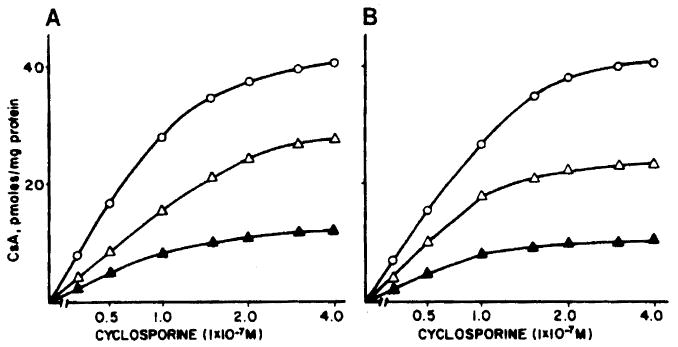
Cellular CsA uptake in the absence of LDL was studied in lymphocytes from two healthy volunteers (other than for Figs 1 and 2). The results of the experiments shown in Fig 2, panels A and B, indicate that, as in the presence of LDL, [3H] CsA uptake in this instance may also involve a saturable process. Because a specific cell surface receptor for CsA has not been identified to date whereas characteristics of a specific cytosolic protein—cyclophilin7—that binds CsA have been described, the data in Figs 3 and 4 may be most compatible with the binding of internalized CsA to cyclophilin or similar protein(s).8 When a 100-fold excess of cold CsA was included in these incubations, the cellular uptake of labeled CsA declined significantly, which suggested a competitive process. The same was true when a 100-fold excess of FK (with respect to the [3H] CsA concentration) was present in the incubations. These data would imply that both FK and CsA may be competing for binding to the same cytosolic components, though not necessarily the same sites.
Fig 2.

Cellular uptake of CsA in PBL incubated with [3H] CsA (○—○) and in the presence of a 100-fold excess of FK (△—△) and unlabeled CsA (▲—▲). Panels A and B are results in two subjects.
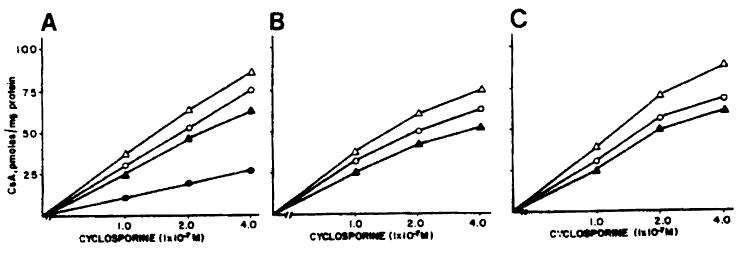
Fig 3.

Lymphocytes were preincubated in 1% BSA in RPMI (panel A) and 1% BSA in RPMI containing 10 μg CsA/mL (panel B) or 1 μg FK/mL (panel C) for 24 hours. The cellular uptake of [3H] CsA was then measured in the absence (○—○) and presence of equivalent amounts of FK (△—△) and cold CsA (▲—▲). ●—● indicates displacement of [3H] CsA in the presence of a 100-fold excess of cold CsA.
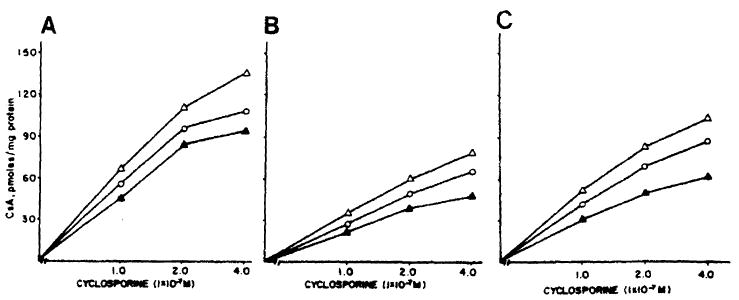
Fig 4.

Lymphocytes were preincubated in RPMI medium containing PHA (panel A), and 10 μg CsA/mL (panel B) and 1 μg FK/mL (panel C) for 72 hours. The cellular uptake of [3H] CsA was then measured in the absence (○—○) and presence of equivalent amounts of FK (△—△) and cold CsA (▲—▲).
In Fig 3 are shown the effects of including equivalent amounts of either FK or cold CsA (1:1, wt/wt) together with [3H] CsA at each point in the incubation medium on the cellular uptake of [3H] CsA (panel A). For panels B and C, the experimental conditions were identical to those in panel A except that cells were preincubated for 24 hours with either 10 μg CsA/mL (panel B) or with 1 μg FK/mL (panel C). Subsequently, the cells were washed and incubated with [3H] CsA as described in Materials and Methods. Under all three conditions, the cellular uptake of [3H] CsA was higher at each concentration of [3H] CsA in the incubation in the presence of equivalent amounts of FK than in its absence. When the cells are preincubated with 10 μg CsA, the absolute uptake of [3H] CsA is reduced in all cases relative to panels A and C, thereby suggesting that some of the cellular CsA binding sites are taken up by unlabeled CsA. However, even under these conditions, inclusion of FK in the medium is able to induce a higher [3H] CsA uptake. Preincubation of cells in the presence of 1 μg FK does not seem to significantly stimulate further the increased CsA uptake (panel C).
PHA-stimulated lymphocytes exhibit a generally increased [3H] CsA uptake (Fig 4, panels A, B, and C), compared with unstimulated cells. Conditions for these experiments were identical to those for experiments in Fig 3 except that preincubations with 10 μg CsA and 1 μg FK/mL of medium were for 72 hours. Again, the uptake of [3H] CsA is enhanced when the incubations contain amounts of FK equivalent to the amounts of [3H] CsA at each point.
Discussion
Several results presented here support the following observations: (1) the drug FK, when present in incubations of lymphocytes with [3H] CsA in equivalent concentrations, enhances the cellular uptake of CsA; and (2) the cellular uptake of CsA appears to involve both specific as well as nonspecific processes, the former taking place when the drug is associated with lipoprotein. In this instance, the CsA-LDL complex may be interiorized via the high-affinity, specific cell surface receptor for LDL. Support for this concept derives partly from the calculations of dissociation constants for various experiments reported here. The double reciprocal plots of data9 from these experiments yield two quite distinct apparent dissociation constants (KD). For the cellular uptake of CsA complexed with LDL, KD = 2.3 and 0.6 × 10⁻⁹ mol/L (Fig 1, panels A and B, respectively). For the data in all of the rest of the experiments, KD = 2 × 10⁻⁷ mol/L (Table 1). The KD of 10−9 mol/L for CsA when in association with LDL certainly suggests high-affinity binding. The rate-limiting step in the LDL pathway is the binding of LDL to a specific high-affinity receptor on the cell surface.10 It may be expected, therefore, that this would be the initial step in the metabolism of CsA bound to LDL. The significantly reduced cellular content of [3H] CsA in the presence of cold LDL appears to strengthen this view. Whether such a binding of CsA-LDL to the LDL receptor followed by further metabolism along the LDL pathway occurs cannot be inferred from the experiments reported here. If true, however, it could represent a significant pathway for CsA metabolism because some 32% of the drug in blood is bound to plasma LDL.1 The concentrations of CsA required to saturate the cellular mechanism(s) responsible for CsA uptake are also different in the presence and absence of LDL, 900 ng/mL with LDL and about 300 ng/mL without LDL. This information further segregates the two processes.
Table 1. Binding of CsA to Lymphocytes.
| Experiment | KD (mol/L) |
|---|---|
| A. [3H] CsA–LDL + PBL(Fig 1) | 2.3 × 10⁻⁹ |
| 0.6 × 10⁻⁹ | |
| B. [3H] CsA + PBL (Figs 2 and 3) + FK (Fig 3) | 2.0 ± 0.5 × 10⁻⁷ |
| 1.9 ± 0.3 × 10⁻⁷ | |
| C. [3H] CsA + PHA-stimulated PBL + FK (Fig 4) | 2.0 ± 0.3 × 10⁻⁷ |
| 2.1 ± 0.1 × 10⁻⁷ |
For experiments B and C, the values expressed are means ± SD; n = 5 and 3, respectively.
The KD of 2 × 10⁻⁷ mol/L when [3H] CsA is incubated with lymphocytes in the absence of LDL is strikingly similar to the reported KD's for CsA binding to cyclophilin,7 calmodulin,11 and perhaps other cytosolic proteins.8 This similarity implies that what is being measured in these experiments (ie, in the absence of LDL) is the binding of [3H] CsA to cytosolic proteins after internalization.
Although the uptake of [3H] CsA is increased in the presence of FK, KD remains unchanged (Table 1). How FK promotes CsA uptake by lymphocytes is not presently known. In preliminary experiments, we have observed that cells incubated with FK under various conditions accumulate the drug intracellulary (Table 2). The kinetics of the process of cellular uptake of FK are currently being investigated.
Table 2. Effect of Preincubation of PBL With FK on the Cellular Content of the Drug.
| Subject | FK (ng/106 Cells) | |
|---|---|---|
| Control* | Experimental* | |
| 1 | a. 0.05 | 0.07 |
| b. 0.12 | 0.25 | |
| 2 | a. 0.19 | 0.38 |
| b. 0.20 | 0.79 | |
| 3 | a. 0.49 | 0.69 |
| b. 1.58 | Not measured | |
PBL were preincubated for 24 hours in 1% BSA with and without (control) 1 μg FK/mL medium.
After preincubation and washings, control and experimental cells were incubated with 1 and 4 × 10⁻⁷ mol/L, a and b respectively, concentrations of FK for one hour. The FK content in the cells was measured by enzyme-linked immunosorbent assay.
Acknowledgments
Supported in part by Grants HL-36416 and AI-23467 from the National Institutes of Health, Bethesda, MD.
References
- 1.Gurecki J, Warty V, Sanghvi A. Transplant Proc. 1985;17:1997. [PubMed] [Google Scholar]
- 2.Havel RJ, Eder HA, Bragdon JH. J Clin Invest. 1955;63:1345. doi: 10.1172/JCI103182. [DOI] [PMC free article] [PubMed] [Google Scholar]
- 3.Bradford M. Anal Biochem. 1976;72:248. doi: 10.1006/abio.1976.9999. [DOI] [PubMed] [Google Scholar]
- 4.Sanghvi A, Warty V. Biochem J. 1985;227:397. doi: 10.1042/bj2270397. [DOI] [PMC free article] [PubMed] [Google Scholar]
- 5.Jerrells TR, Dean JH, Richardson GL, et al. J Immunol Methods. 1980;32:11. doi: 10.1016/0022-1759(80)90113-1. [DOI] [PubMed] [Google Scholar]
- 6.Kaplan ME, Clark C. J Immunol Methods. 1968;5:131. doi: 10.1016/0022-1759(74)90003-9. [DOI] [PubMed] [Google Scholar]
- 7.Handschumacher RE, Harding MW, Rice J, et al. Science. 1984;226:544. doi: 10.1126/science.6238408. [DOI] [PubMed] [Google Scholar]
- 8.Fabre I, Fabre G, Lena N, et al. Biochem Pharmacol. 1986;35:4261. doi: 10.1016/0006-2952(86)90704-5. [DOI] [PubMed] [Google Scholar]
- 9.Gal D, Simpson DR, Porter CS, et al. J Cell Biol. 1982;92:597. doi: 10.1083/jcb.92.3.597. [DOI] [PMC free article] [PubMed] [Google Scholar]
- 10.Goldstein JL, Brown MS. J Biol Chem. 1974;249:5153. [PubMed] [Google Scholar]
- 11.Colombani PM, Robb A, Hess AD. Science. 1985;228:337. doi: 10.1126/science.3885394. [DOI] [PubMed] [Google Scholar]


