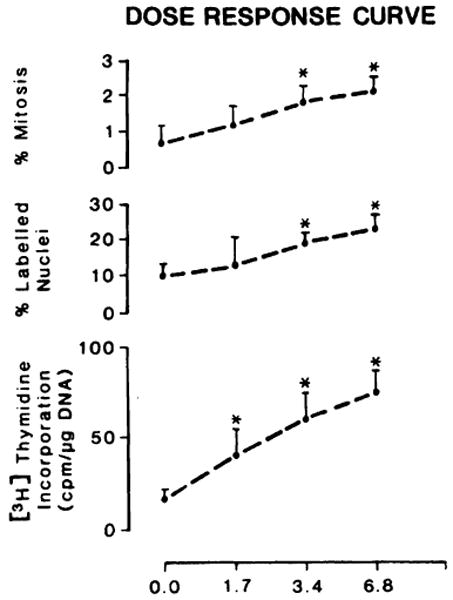
Fig. 4.

Dose-response curve in 40% hepatectomized rats given injections of F150. The experimental conditions are the same as those reported in Fig. 1. Control animals (10) were given injections of PBS containing 6.6 μg of serum albumin. DNA synthesis, percentage of labeled nuclei, and percentage of mitosis were done as reported in “Materials and Methods.” Points, averages of 10 determinations for each level of F150; bars, SD. *, significantly different from the control value (PBS) (P < 0.05).
