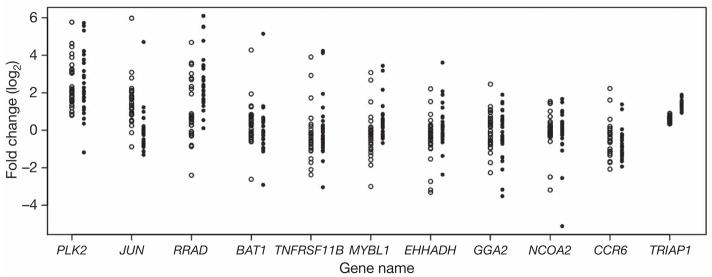
Figure 1. Individual variation in gene expression response to ionizing radiation.
Fold change in 11 radiation-responsive genes; data for each individual are shown as a circle (open circles for 2-h-after-irradiation expression phenotypes; filled circles for 6-h-after-irradiation expression phenotypes). TRIAP1 (TP53-regulated inhibitor of apoptosis 1) is shown as an example of a gene that showed little individual variation in response to ionizing radiation. Other genes show extensive individual variation in gene expression.

