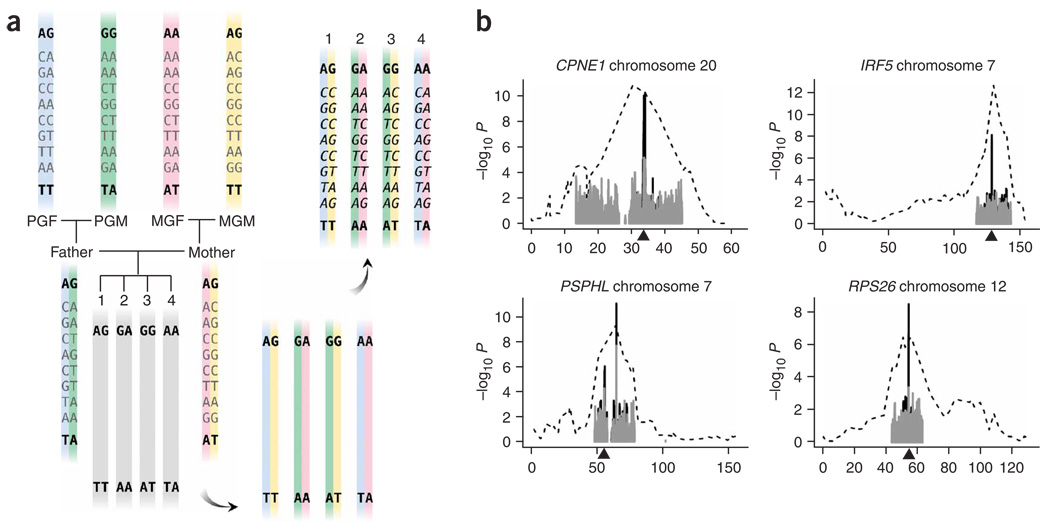
Figure 1.
Genotype inference. (a) Inferred genotypes for eight SNPs. The inferred genotypes for each child are shown in italics. To determine the inferred genotypes, we identified regions of shared IBD (color-coded) between the child and her parents and grandparents using low-density genotypes (boldface) and used-high density genotypes (light gray) of the grandparents and parents. For illustration purposes, the grandparental genotypes are shown as phased. In practice, this is resolved by an IBD estimation program. (b) Comparison of data from QTDT analysis for four representative expression phenotypes. For each phenotype, results from linkage analysis based on 14 CEPH families (dotted line), QTDT analysis with genotypes for 30 trios from the HapMap Project (gray bars) and with the combined HapMap and inferred genotypes (black bars) are shown. For the linkage analysis, the null hypothesis is no linkage, and for the QTDT, the null hypothesis is no linkage or no association.

