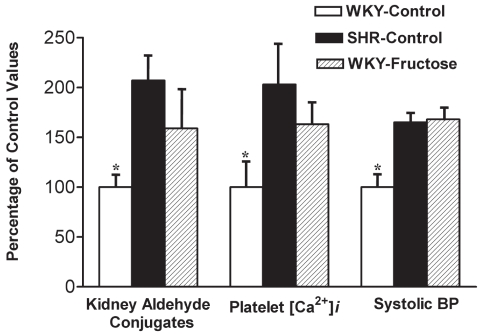
Figure 2).
The bar graph shows kidney aldehyde conjugates, platelet free Ca2+ concentration ([Ca2+]i) and systolic blood pressure (BP) in spontaneously hypertensive rats (SHRs) and fructose-induced hypertensive Wistar-Kyoto (WKY) rats. Starting at seven weeks of age, rats were divided into three groups of six animals each. For a period of 14 weeks, animals in the WKY-control and SHR-control groups were given a normal diet and normal drinking water; the WKY-fructose group was given a normal diet and 4% fructose in drinking water. All values (mean ± SD) are expressed as a percentage of the WKY-control group at the completion of the study at 21 weeks of age. *Values are significantly different (P<0.05) from other groups. Data from references 4 and 5

