Figure 7).
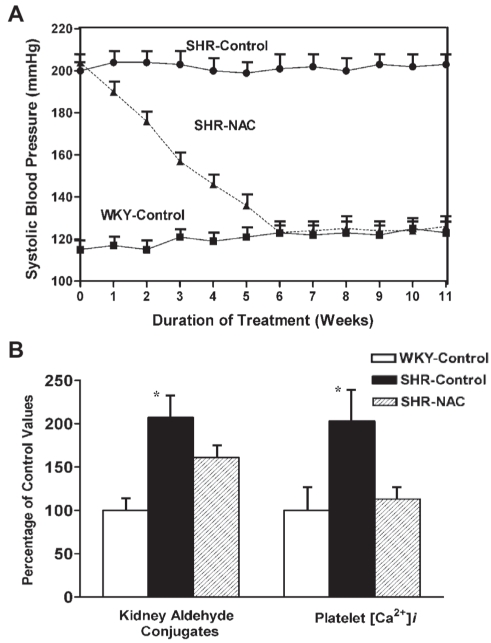
A The line graph shows the effect of N-acetylcysteine (NAC) on systolic blood pressure in spontaneously hypertensive rats (SHRs). Starting at 12 weeks of age, animals were divided into three groups of six animals each. For the next 11 weeks, the SHR-control and Wistar-Kyoto (WKY)-control groups were given a normal diet and normal drinking water and the SHR-NAC group was given 1.5% NAC in the diet and normal drinking water. Data are presented as mean ± SD of the six animals in each group. Values are significantly different (P<0.05) from one to 11 weeks in the SHR-control group compared with the other groups of the same age. B The bar graph shows the effect of NAC on kidney aldehyde conjugates and platelet free Ca2+ concentration ([Ca2+]i) in SHRs and WKY rats. The experimental groups and treatment period were the same as in A. All values (mean ± SD) are expressed as a percentage of the WKY-control group at the completion of the study at 23 weeks of age. *Values are significantly different (P<0.05) from other groups. Data from reference 5

