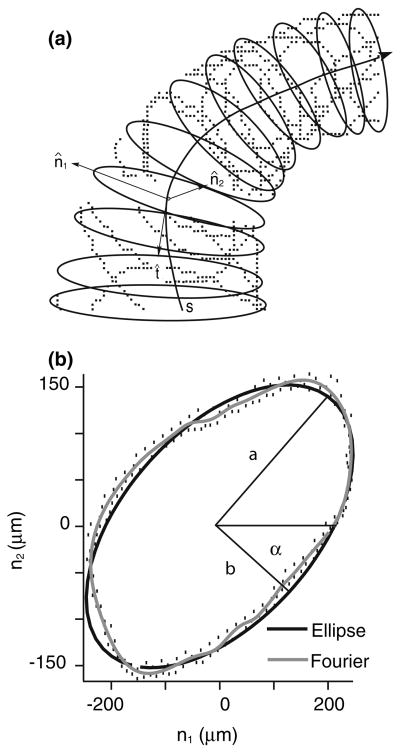
FIGURE 4.
Data fitting. A 10-term Fourier series, an ellipse (2-term Fourier series) and a circle (1-term Fourier series) were fitted to the selected slice of data points (Fig. 3) at each center point using least squares. The resulting fitted contours lie in the normal (n̂1) − (n̂s)plane and define the cross-sectional area perpendicular to the centerline tangent vector (a). The 10-term Fourier series curve (b, gray contour) closely reproduced details of the canal cross-sectional shape, but overall the shape and cross-sectional area were well represented by an ellipse (b, black contour; also see Results).

