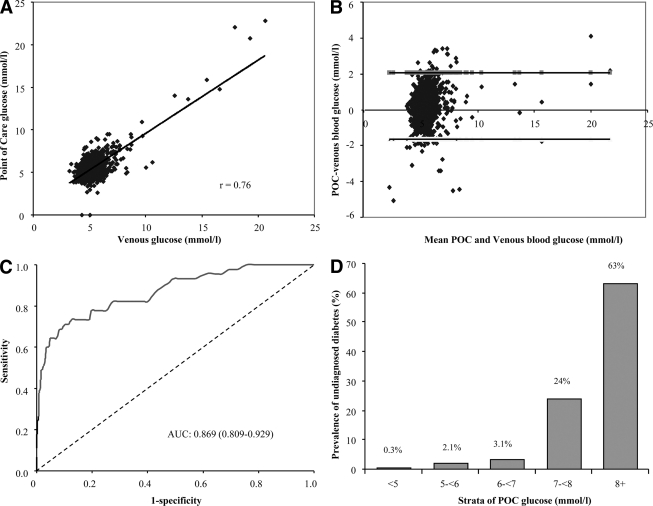
Figure 1.
Concordance between laboratory venous blood glucose analysis and POC glucose analysis. A: Pearson correlation and scatter plot (n = 994). B: Differences vs. means plot (Bland and Altman plot) of fasting capillary blood glucose measured by POC glucose testing (B. Braun) glucose meter and the venous laboratory glucose measurement. The horizontal top and bottom line represent ± 2 SD. C: Discriminatory power of POC glucose in predicting undiagnosed diabetes (participants were categorized as diabetics and nondiabetics based on fasting venous blood glucose measurement). D: Prevalence of undiagnosed diabetes (based on laboratory venous glucose analysis) in strata defined by POC capillary blood glucose level.

