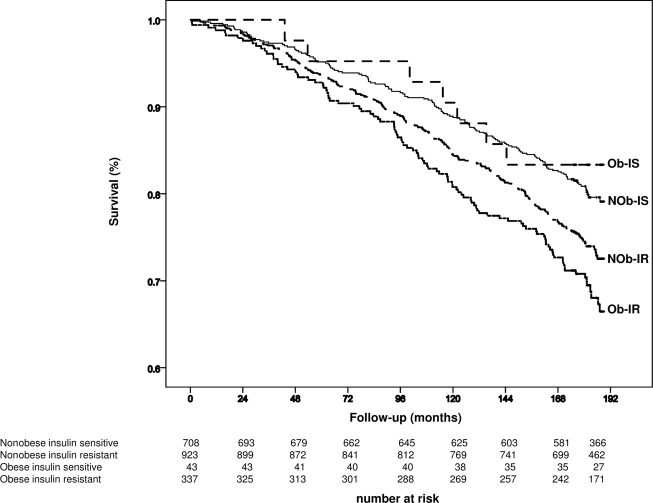
Figure 1.
Survival by Kaplan-Meier estimates of all-cause mortality. Follow-up period was 15 years (180 months). Subjects were divided according to BMI (nonobese: <30 kg/m2; obese: ≥30 kg/m2) and estimated insulin resistance (insulin sensitive: HOMA-IR <2.5; insulin resistant: ≥2.5). At the bottom are the detailed figures of the number at risk for each subgroup of individuals. NOb-IR, nonobese insulin-resistant subjects; NOb-IS, nonobese insulin-sensitive subjects (the reference); Ob-IR, obese insulin-resistant subjects; Ob-IS, obese insulin-sensitive subjects.

