
Figure 1.
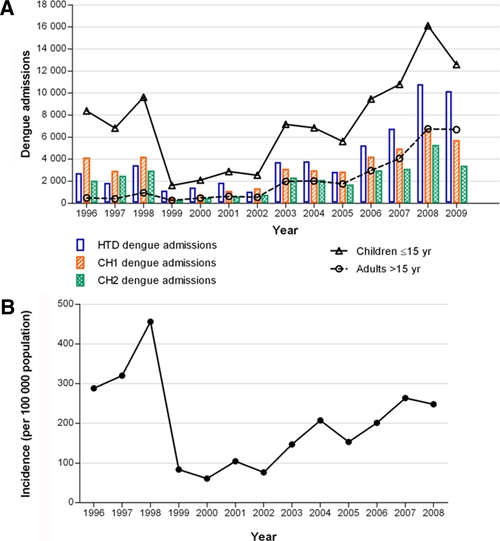
Temporal trends in dengue admissions in Ho Chi Minh City, Vietnam, from 1996 to 2008. (A) Bars show the number of in-patients with clinically diagnosed dengue each year at each of the three study hospitals. Lines show the number of dengue cases in children aged 15 years or less (triangles) and adults over the age of 15 (circles) combined across the study sites. (B) Shown for comparison is the annual incidence of hospitalized dengue per 100,000 people in the southern 20 provinces of Vietnam derived from cases reported through the southern Vietnam dengue surveillance system. Data collated by and reproduced with permission from the Pasteur Institute HCMC. This figure appears in color at www.ajtmh.org.