
Figure 2.
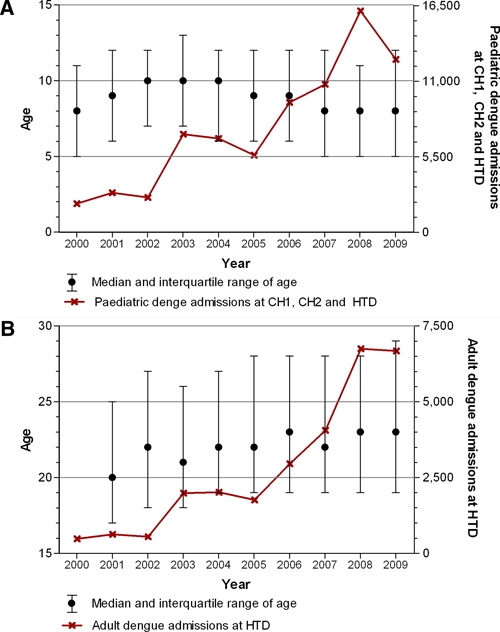
Age distribution of hospitalized dengue cases. (A) Circles show the median and lines show the interquartile range of the age of pediatric dengue patients admitted to Children's Hospitals 1 and 2 (CH1 and CH2) and the Hospital for Tropical Disease (HTD) each year from 2000 to 2009. In 2000, there was no data from HTD. The solid line indicates the total number of pediatric admissions for dengue (≤ 15 years) across the three hospitals each year. (B) Circles show the median and lines show the interquartile range of the age of adult dengue patients admitted to HTD each year from 2001 to 2009. The solid line indicates the total number of adult admissions for dengue (> 15 years) at HTD each year. This figure appears in color at www.ajtmh.org.