
Figure 3.
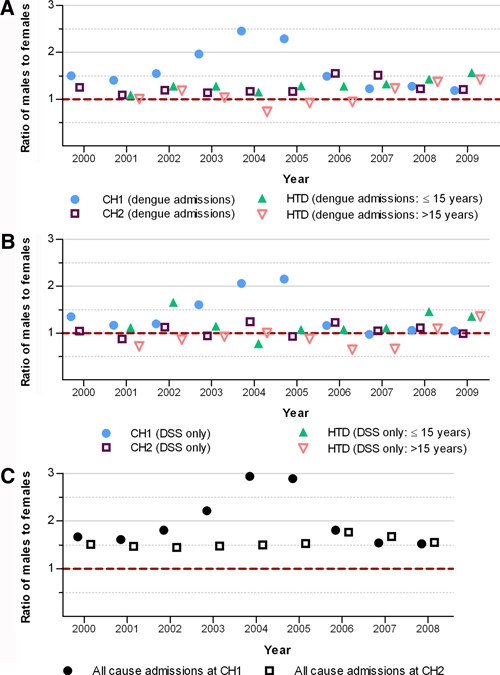
Male to female ratio of dengue patients and total hospital admissions. Points indicate the male to female ratio each year for (A) total dengue admissions, (B) cases of dengue shock syndrome, and (C) all-cause admissions by hospital: Children's Hospital Number 1 (CH1; circles), Children's Hospital Number 2 (CH2; squares), and Hospital for Tropical Diseases (HTD; triangles). The dashed line indicates an equal ratio of males and females. This figure appears in color at www.ajtmh.org.