Figure 2.

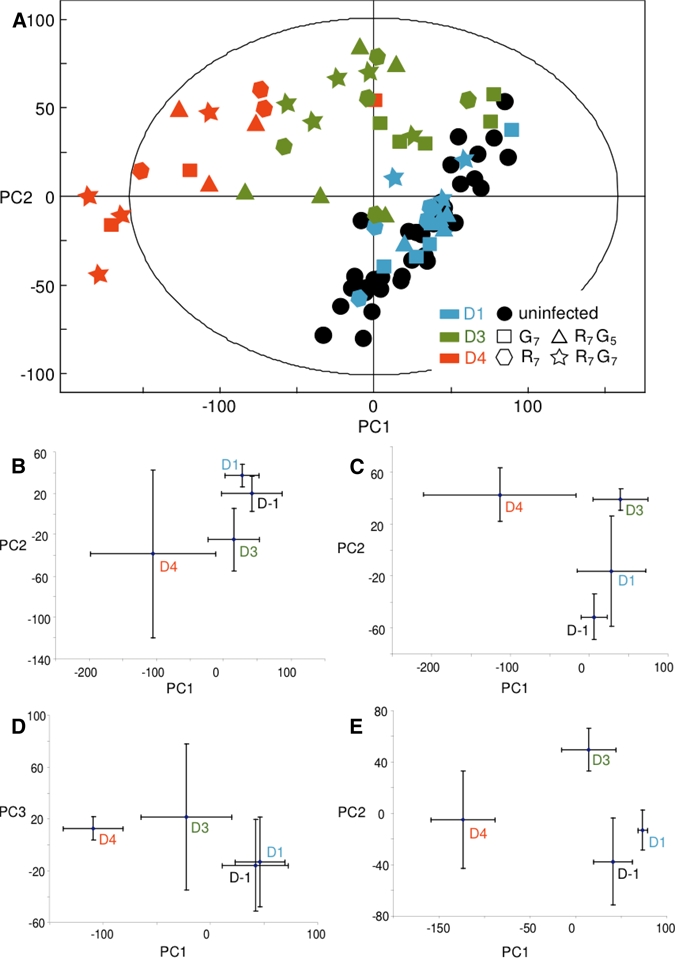
Principal component analysis (PCA) trajectory scores plots. (A) Plot derived from urinary nuclear magnetic resonance (NMR) spectra of all mice 1 day preinfection (black) and on days 1 (no fill), 3 (grey), and 4 (black radial) postinfection (G7; “square,” R7; “hexagon,” R7G5; “triangle,” R7G7; “star”). The group of uninfected mice (black) contains the measurements of all treatments before infection and measurements of uninfected control mice on days 1, 3, and 4 in this graph. The first two principal components (PC1 and PC2) explain 26.3% and 10.6% of total variance in the data, respectively. Sub-level PCA time trajectory plots derived from treatments (B) R7, (C) G7, (D) R7G5, and (E) R7G7 showing differentiation of preinfection (D−1) and postinfection at each time point (D1, D3, and D4). See Table 2 for treatment details. This figure appears in color at www.ajtmh.org.
