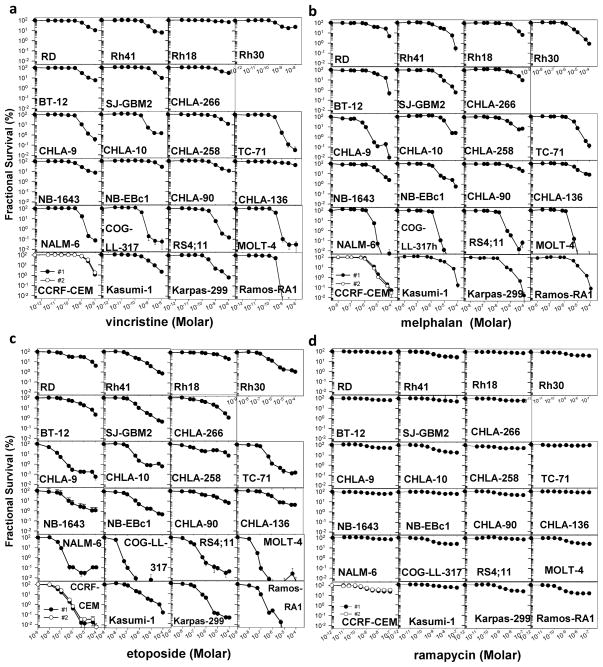
Fig. 2.
Dose-response curves to vincristine (0.003 – 10 nM, a), melphalan (0.01 – 100 μM, b), etoposide (0.01 – 100 μM, c), and rapamycin (0.01 – 100 nM, d) obtained by DIMSCAN analysis of the PPTP in vitro panel. The two plots for CCRF-CEM represent the independent testing of this cell line by two different technicians (● technician #1, ○ technician #2) that are used for quality control of the data.

