
Figure 5.
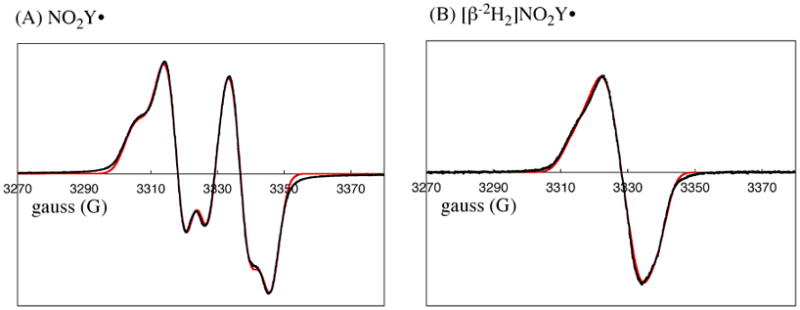
9 GHz EPR spectra of (A) NO2Y122• and (B) [β-2H2]NO2Y122•. Experimental data (black trace) and simulation (red trace) are shown. The parameters used for the simulation are summarized in Table 1.
Official websites use .gov
A
.gov website belongs to an official
government organization in the United States.
Secure .gov websites use HTTPS
A lock (
) or https:// means you've safely
connected to the .gov website. Share sensitive
information only on official, secure websites.
9 GHz EPR spectra of (A) NO2Y122• and (B) [β-2H2]NO2Y122•. Experimental data (black trace) and simulation (red trace) are shown. The parameters used for the simulation are summarized in Table 1.