
Figure 3.
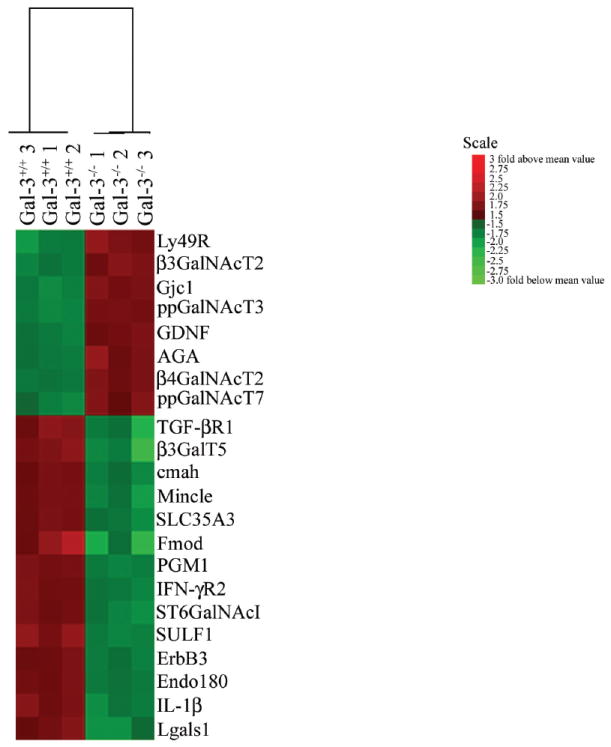
Heat map of 22 differentially expressed genes (change, >1.3-fold; P < 0.01). All signals are compared to a median value, and change (x-fold) from the median is visually represented by color assignment (Scale at right). Healing Gal-3-deficient (Gal-3−/−) and healing wild-type (Gal-3+/+) corneas showed visibly distinct profiles of gene expression.