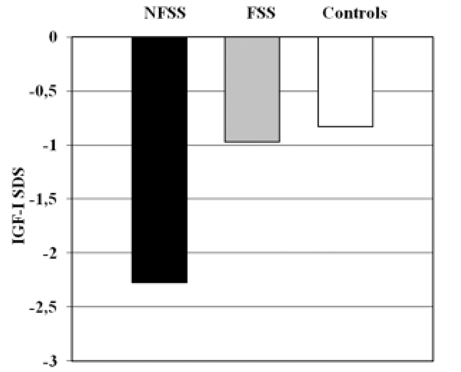
Figure 1. Mean serum IGF−I SDS concentration between NFSS (Non Familial Short Stature: height ≤−2 SDS and corrected target ≤−1.9 SDS), FSS ( Familial Short Stature: height ≤−2 SDS and corrected target >−1.9 SDS) and control group (height >−2 SDS). Data are expressed in mean ± SEM. Personal unpublished data.

