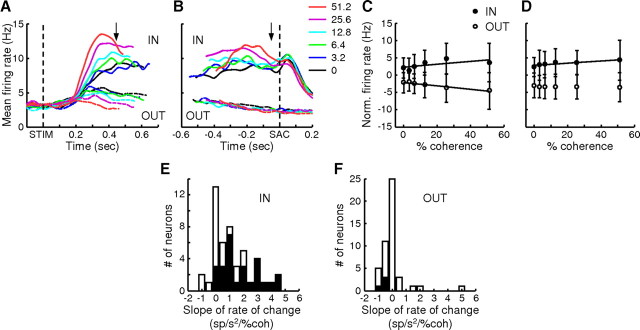
Figure 5.
Population summary of neurons with evidence accumulation activity. A, Population average of activity aligned on stimulus onset for correct trials (n = 47). Data for each choice (solid lines, IN trials; dashed lines, OUT trials) and coherence level (colors; see inset in B) were truncated at the median value of the mean RT measured under those conditions for all cells. Activity after 100 ms preceding saccade onset was excluded. B, Population average of activity aligned on saccade onset, plotted as in A. Activity within 200 ms of stimulus onset was excluded. C, D, Population average (mean ± SEM) of normalized firing rate as a function of coherence in 100 ms windows before the median RT (arrow in A, which indicates only an approximate time because of session-by-session variability in mean RT) and before saccade onset (arrow in B), respectively. For each neuron, the firing rate in an epoch was normalized by the average rate across all trial conditions in the same epoch. Filled circles, IN trials; open circles, OUT trials. Lines are linear fits with slopes that were significantly different from zero (p < 0.05). E, F, Histograms of the slope of the rate of change in activity during motion viewing for IN (E) and OUT (F) trials. Solid bars, F test, H0: slope = 0, p < 0.05.

