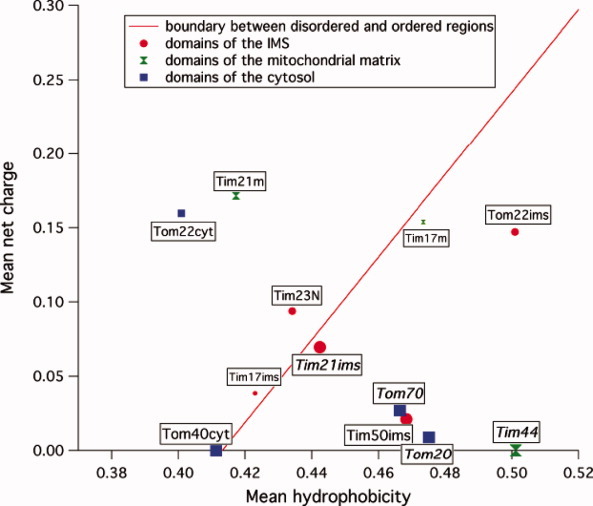
Figure 7.

Charge-hydropathy plot of soluble domains of TOM and TIM23. Soluble domains are represented according to their location in the cytosol (blue squares), the intermembrane space (red circles), or the matrix (green diamonds). The order–disorder boundary is shown as red line. The size of the domains correlates with the size of the symbol: <40 residues (small), 40–100 residues (medium), and >100 residues (large). Domains of known structure are labeled italics.
