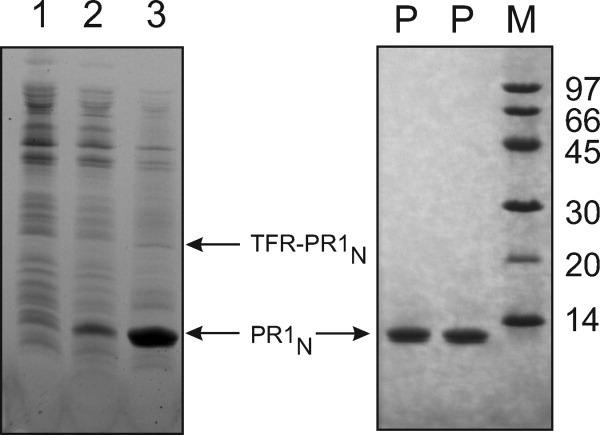
Figure 2.

Expression and purification of TFR-PR1N and PR1N. Left: SDS-PAGE to monitor the expression and autoprocessing of TFR-PR1N construct in E. coli. Lanes 1 and 2 represent the total lysates derived from uninduced and induced cells, respectively. Lane 3, insoluble pellet derived from washing the initial insoluble fraction (post cell lysis) with 1M urea and 0.5% Triton X-100. The presence of a major band of PR1N and a faint band of TFR- PR1N in lane 3 indicates that (1) majority of the precursor undergoes autoprocessing upon its expression to release the mature PR1N and (2) both TFR-PR1N and PR1N accumulate in the insoluble fraction and are retained in this fraction even after washing with 1M urea. Right: SDS-PAGE of purified PR1N. Lanes denoted by P represent purified PR1N, used for the various physicochemical and structural analyses described in this article, and M, the molecular weight standards in kDa.
