Figure 9.

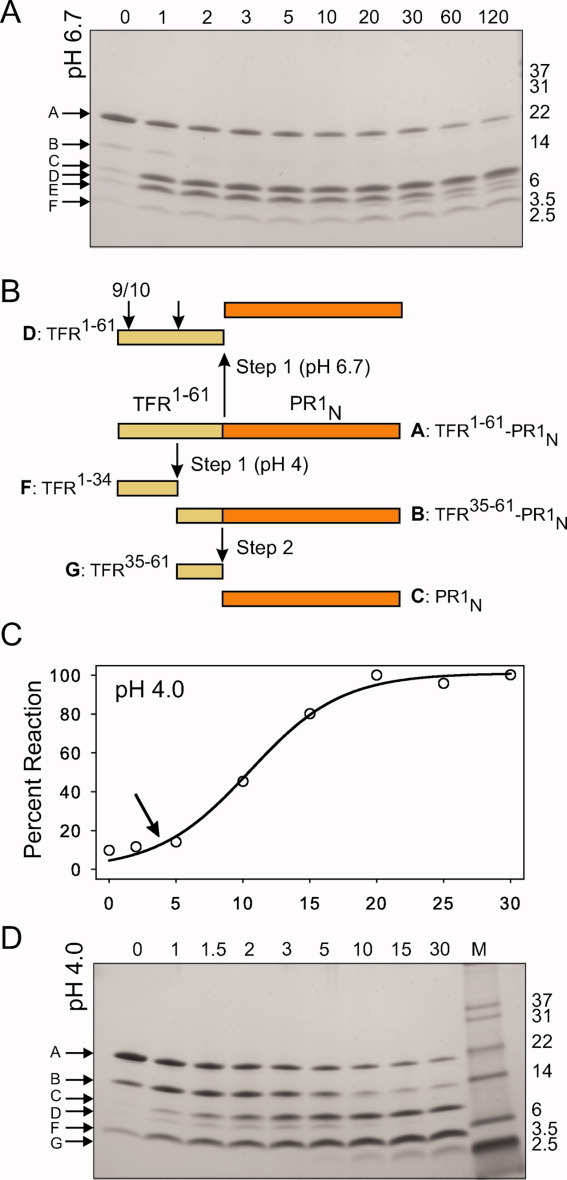
Pathways for the autocatalytic maturation of TFR-PR1N at pH 4 and 6.7. For experimental details, see text. A: Time course of the autoprocessing reaction at pH 6.7 showing a single major cleavage between the TFR 1–61 (band D) and the N-terminus of the protease domain (band C, PR1N). Subsequent cleavage of the TFR 1–61 occurs between residues 9/10 and 34–35 (band E, TFR 10–61 and band F, TFR 1–34). B: Schematic representation of the sites of sequential cleavages at pH 4 (downward arrows) and the predominant cleavage at pH 6.7 (upward arrow). Letter designations shown for the intermediates and products correspond to the band labels in Figure 9(A,D). C: Time course of appearance of mature protease activity at pH 4.0 measured by kinetic assays of samples taken at the times indicated in minutes. The lag (arrow) is due to the formation of intermediate B, which exhibits the same low activity as that of the full-length TFR-PR1N. Cleavage at the N-terminus of the protease is concomitant with the appearance of the mature protease (band C) and mature-like catalytic activity. D: Time course of processing at pH 4 showing initial cleavages at L34/W35 of the TFR (to give B and F) followed by cleavage of the resultant intermediate B to release the TFR 35–61 (G) and the mature protease (C).
