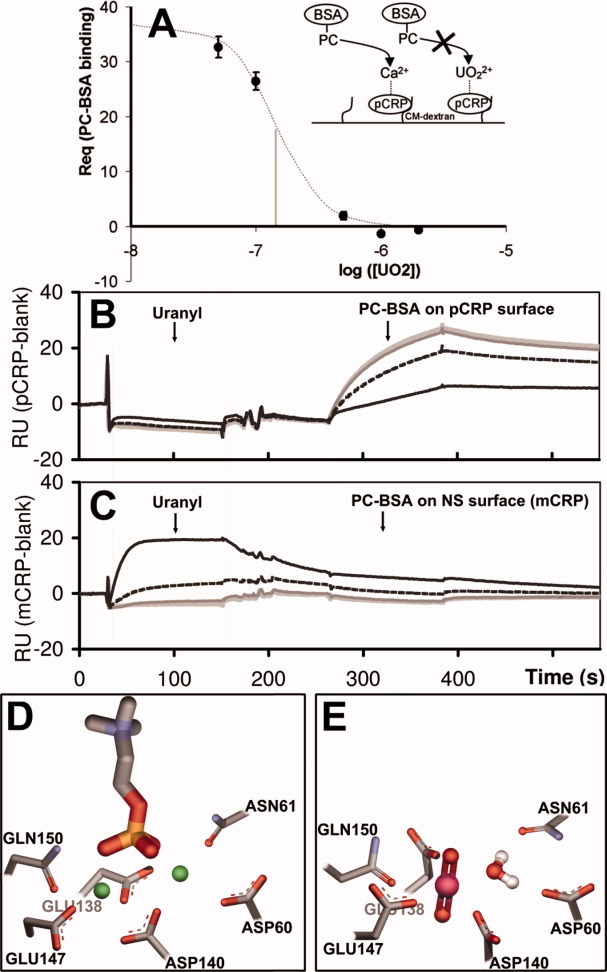
Figure 4.

SPR binding inhibition assays. (A) Schematic and SPR data plot of  inhibition (IC50 = 0.16 μM) of PC-BSA ([PC-BSA] =100nM) binding to CRP (838 immobilized RU). B,C: SPR sensorgrams showing the effect of a
  preinjection on the capacity to bind PC-BSA for pCRP (B) and mCRP (C). An increasing concentration of captured
  (light grey: 0 μM; dark grey: 0.1 μM; dashed black: 0.5 μM; black: 2 μM) only added at a capture stage results in the clear inhibition of PC-BSA (100 nM) binding on native CRP (838RU of immobilized pCRP). mCRP used for nonspecific monitoring shows no
  dependant signal modulation. In supporting information Figure S2,
  is also added with PC-BSA, resulting in complete inhibition of PC-BSA binding. (D) CRP calcium binding site from PDB structure 1B09 chain C (sticks) showing calcium atoms (green spheres) and the phosphorylcholine molecule (sticks). E: Predicted site geometry of the U-CRP complex upon uranyl cation and water molecule binding. Once bound, the uranyl ion prevents the phosphorylcholine molecule from docking with CRP. [Color figure can be viewed in the online issue, which is available at wileyonlinelibrary.com.]
