
Figure 2.
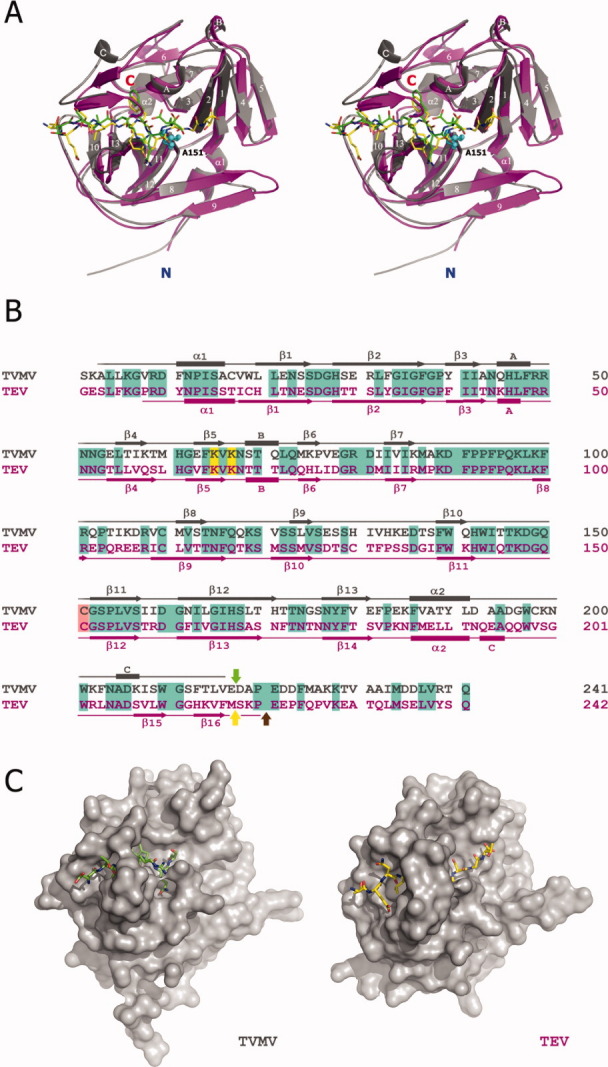
Comparison between TVMV and TEV proteases. (A) Stereoview of superposition of the crystal structures of TVMV (Chain B, gray) and TEV (PDB ID: 1LVB, Chain A, magenta) proteases with their peptide substrates. Secondary structure elements are labeled according to the TVMV structure. Canonical peptide substrates bound to TVMV and TEV proteases are shown in green and yellow, respectively. The N- and C-termini of the proteases are labeled in blue and red, respectively. The side chains of the mutated catalytic residue (C151A in TVMV protease) from both structures are shown as cyan spheres. (B) Sequence alignment of TVMV (gray) and TEV (magenta) proteases. The secondary structures were determined by the results from iMolTalk server (http://i.moltalk.org/). β-strands and α-helices are numbered and 310-helices are labeled A–C. Identical residues are shaded in cyan. Two surface entropy reduction mutation sites (K65&K67) are shaded in yellow. The active-site cysteine residues are shaded in salmon. The self-cleavage site within TEV protease is indicated by the yellow arrow. The C-termini of available crystal structure models of TEV protease (PDB ID: 1LVB and 1LVM) are denoted by the brown arrow. The C-terminus of the truncated TVMV protease (TVMV1–217 protease) investigated in this study is indicated by the green arrow. (C) Surface representation of TVMV (left) and TEV (right) proteases viewed at the same angle.