
Figure 4.
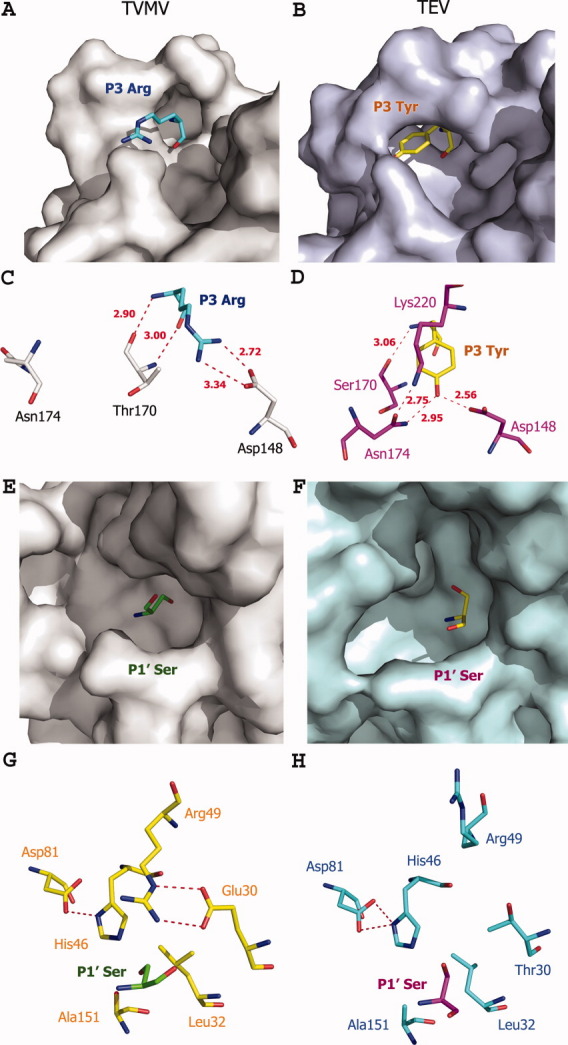
Comparison of the S1′ and S3 subsites in TVMV and TEV proteases. Left and right panels refer to the TVMV and TEV protease, respectively. (A, B) Surface representation of the S3 subsites. P3 residues are colored cyan (TVMV) and yellow (TEV). (C, D) Hydrogen-bond interaction at the S3 subsites. Residues from TVMV and TEV protease are colored gray and magenta, respectively. (E, F) Surface representation of the S1′ pockets. P1′ Ser residues of the peptide substrates are colored green (TVMV) and yellow (TEV). (G, H) Hydrogen-bond interactions in the S1′ pockets. Residues are shown in ball-and-stick representation. The hydrogen bonds are shown as dashed lines colored red. Residues from TVMV and TEV proteases are colored yellow and cyan, respectively. P1′ Ser residues of the peptide substrates are colored in green (TVMV) and magenta (TEV).