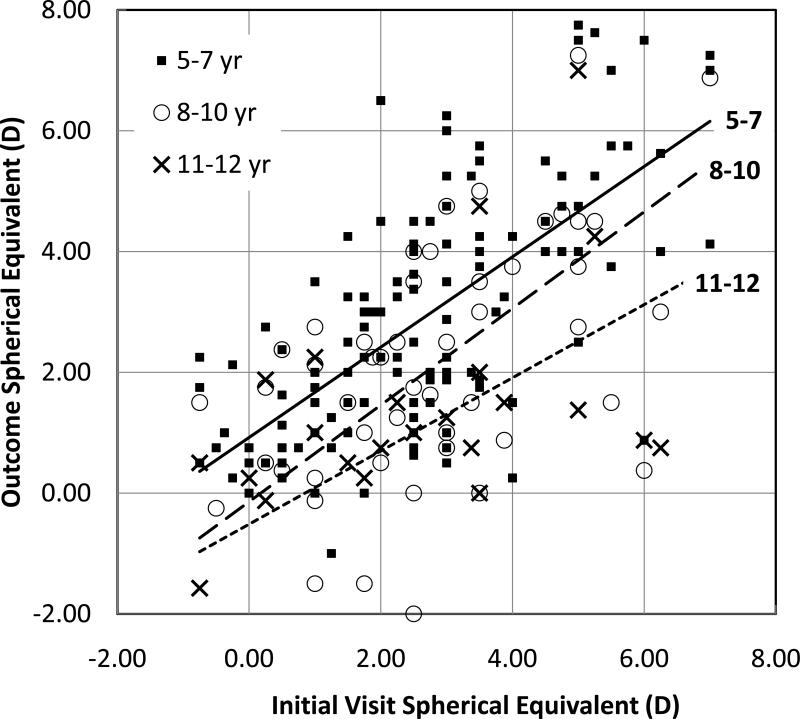
Figure 2.
Spherical equivalent of the right eye at the 5-7, 8-10, and 11–12 year outcome visits related to spherical equivalent at the initial visit. Lines show the best fit linear regression for each outcome visit on initial visit refraction. The best fit lines for regression of outcome refractive error on initial refractive error was y=0.75×+0.92 (r=0.67) for outcome at 5-7 years, y=0.80×-0.14 (r=0.61) for outcome at 8-10 years, and y=0.61×-0.52 (r=0.56) for outcome at 11-12 years.

