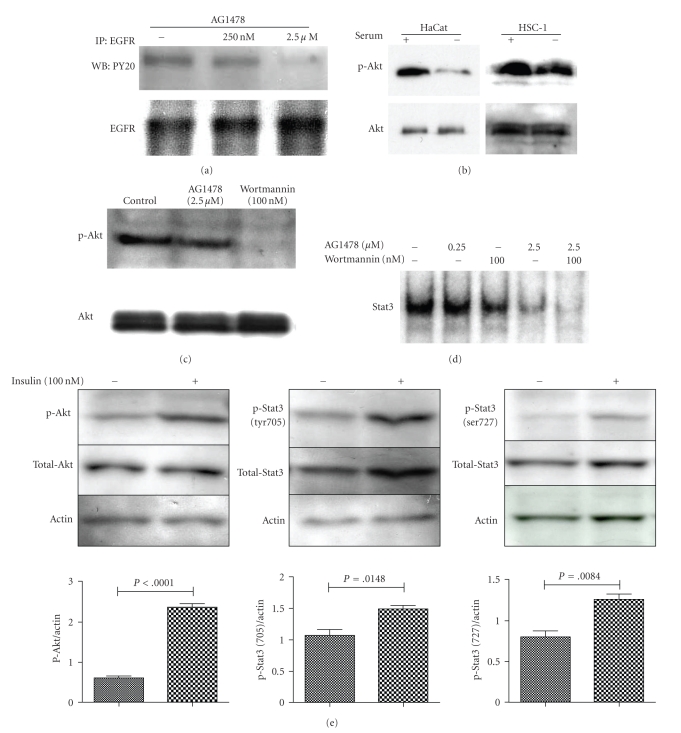
Figure 4.
Effect of wortmannin, AG1478, and insulin on activation of Stat3 and Akt in HSC-1 cells. HSC-1 cells were incubated in serum free medium for 24 h, and were then treated with AG1478 at the indicated concentration for 1 h. The cell lysates were subjected to IP with the anti-EGFR antibody. The same membrane was then reprobed with the anti-EGFR antibody (a). The cells were incubated with or without serum for 24 h, and then each lysate was immunoblotted with anti-p-Akt antibody, and then reprobed with the anti-Akt antibody (b). HSC-1 cells were incubated in serum free medium for 24 h, and were then treated with AG1478 or wortmannin for 1 h. The cell lysates were immunoblotted with the anti-p-Akt antibody, and then reprobed with the anti-Akt antibody (c). HSC-1 cells were incubated in serum free medium for 24 h, and were then treated with AG1478 and/or wortmannin at the indicated concentration for 1 h. DNA binding activity of Stat3 was analyzed using EMSA (d). HSC-1 cells were incubated without serum for 24 h, and were then treated with or without insulin for 15 min. The cell lysates were immunoblotted with each of the anti-p-Akt or p-Stat3 antibody and then reblotted with human actin as a loading control. The same membrane was reprobed with the anti-Stat3 or Akt antibody (e). The bar graphs are expressed as the relative ratio of p-Akt or Stat3 protein expression to actin protein expression by densitometry. Data are mean ± SD of three independent experiments. P < .05 are statistically significant when compared with the non-treated control (e).

