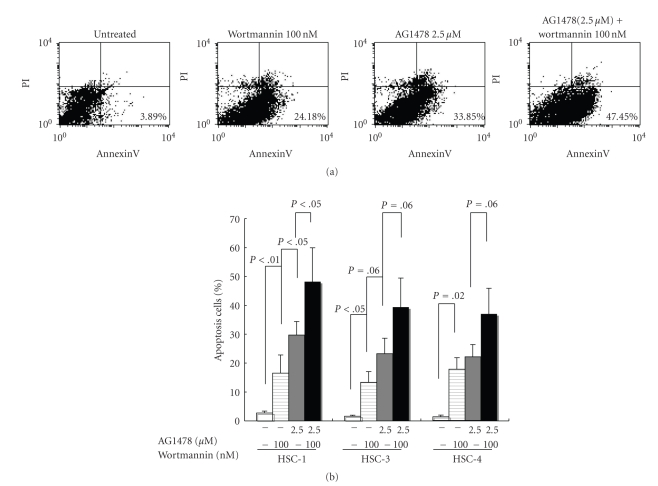
Figure 6.
Analysis of apoptosis induced by AG1478 and wortmannin in HSC-1 cells. HSC-1 cells were incubated with AG1478 and/or wortmannin at the indicated concentration for 24 hours. Cells were incubated with Annexin V-FITC in a buffer containing propidium iodide (PI) and analyzed by flow cytometry (a). Data are representative of at least four independent experiments. Annexin V-FITC positive and PI negative cells are apoptotic (lower right quadrant) (a). Annexin V-FITC positive and PI positive cells are necrosis (upper right quadrant) (a). HSC-1, 3, and 4 cells were incubated with AG1478 (2.5 μM) and/or wortmannin (100 nM) for 24 hours. Cells were incubated with Annexin V-FITC in a buffer containing propidium iodide (PI) and analyzed by flow cytometry. Results are means ± SD of at least three independent experiments (b). Statistical significance of the difference between each group was determined using Student's t-test and analysis of variance.

