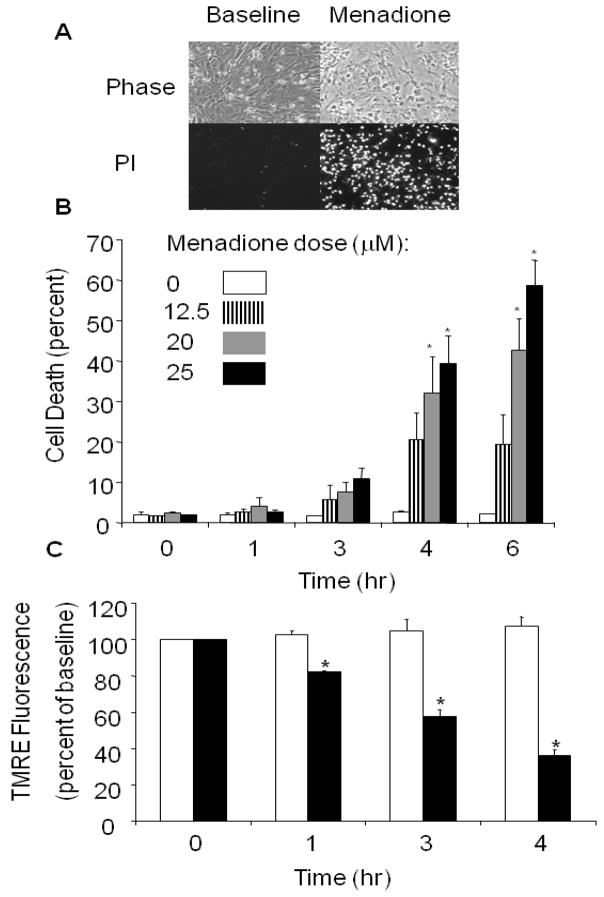
Figure 2.
Menadione-induced cell death in cardiomyocytes. (A) Phase contrast images of cardiomyocytes at baseline and after 6 hrs of menadione (25 μmol/L) treatment (upper panel). Loss of plasma membrane integrity was confirmed by propidium iodide uptake (lower panels). (B) Menadione-induced cell death occurred in a time- and dose-dependent manner (Mean values ± SE, [0–3 hrs, n=4] [4–6 hrs, n=6]; * p<.05 compared with 0 hr controls). (C) Mitochondrial potential, as assessed using tetramethylrhodamine ethyl ester (TMRE). Fluorescence intensity was measured in cardiomyocytes loaded with TMRE under control conditions and during exposure to menadione (25 μmol/L). A significant decrease in TMRE fluorescence was detected as early as 1 hr after menadione treatment. Values are expressed as percent of baseline intensity (n=4; * p<.05) compared with controls. White bars indicate control cells and dark bars indicate menadione-treated cells.

