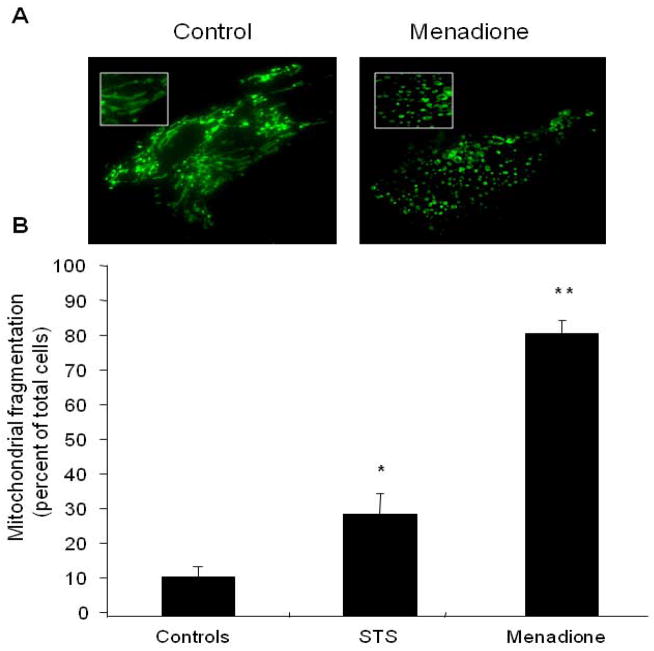
Figure 3.
Mitochondrial morphology in cardiomyocytes treated with menadione. (A) Control cells demonstrate a normal reticular mitochondrial morphology. Cells exposed to menadione (25 μM, 4 hrs) demonstrated significant mitochondrial fragmentation. (B) Analysis of cells exhibiting fragmented mitochondrial morphology after treatment with menadione, or the apoptosis-inducing agent staurosporine (STS, 1 μM, 6 hrs). (n=3; *STS vs. controls p<0.05; **menadione vs. STS and controls p<0.05)

