Figure 5.
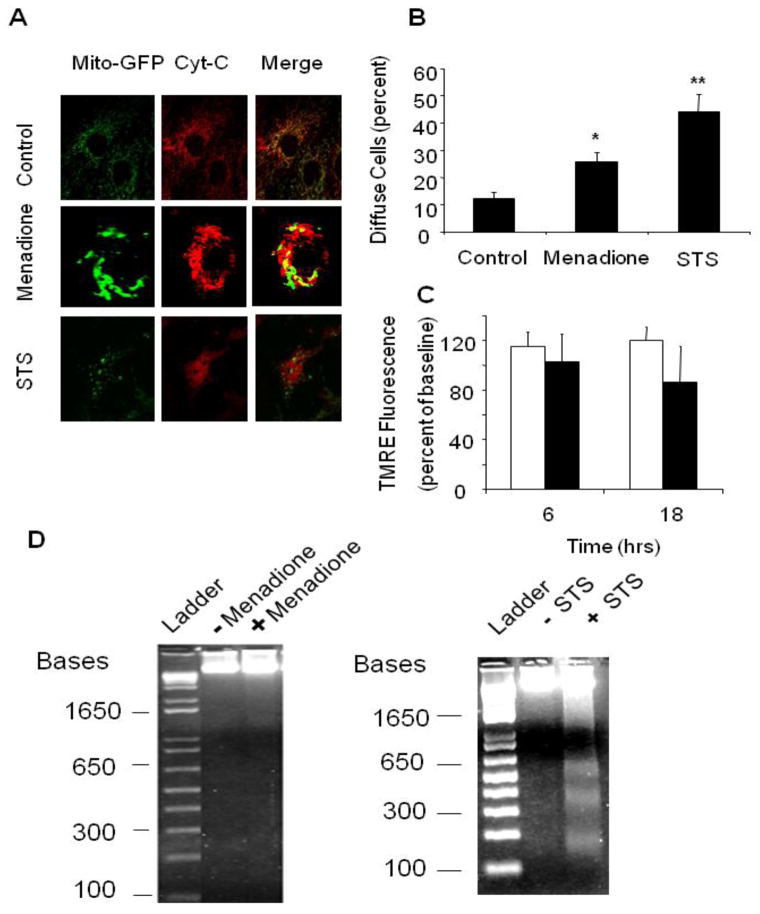
Apoptotic markers in response to menadione or staurosporine (STS). (A) Immunofluorescence analysis of cytochrome c distribution in cardiomyocytes revealed a normal mitochondrial reticular pattern that co-localized with mitochondria-targeted GFP expression under control conditions. A diffuse cytosolic staining pattern developed after menadione treatment, and after staurosporine treatment. (B) A significant increase in the percentage of cells demonstrating cytochrome c release was observed after menadione treatment or staurosporine treatment (n=10; *p<0.05 compared with controls, **p<0.05 compared with menadione). (C) TMRE fluorescence measurements of mitochondrial potential at 6 and 18 hr after STS treatment (dark bars), compared with control cells (white bars). Although a small trend was noted, this did not reach statistical significance. (D) Left: Representative gel electrophoresis showing an absence of DNA fragmentation in cells exposed to menadione (25 μM) for 6 hrs compared with controls. (lanes: 1 - ladder, 2 - control, 3 - menadione). Right: Representative gel showing the presence of DNA fragmentation after staurosporine for 6 hrs. (lanes: 1 - ladder, 2 - control, 3 - staurosporine).

