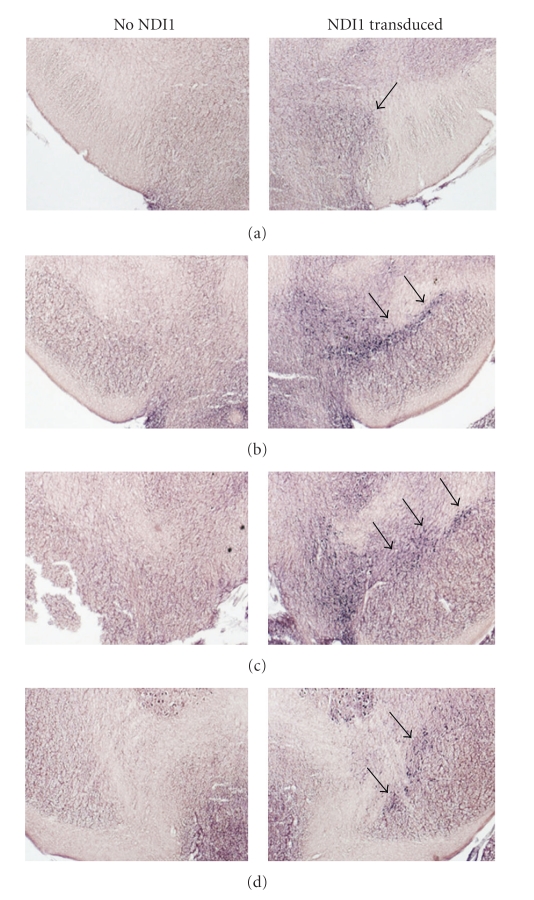
Figure 2.
Representative SN images from the NDI1 + Saline group demonstrating the spread of functional NDI1 2 months after injection. Expression of NDI1 was revealed by NADH activity staining. Image position is given relative to the injection point, which was determined by the presence of fluorescent beads added to rAAV solution prior to injection. (a) ~150 μm anterior of injection point, (b) point of injection, (c) ~180 μm posterior of (b), and (d) ~720 μm posterior of (b). Arrows indicate the SN.

