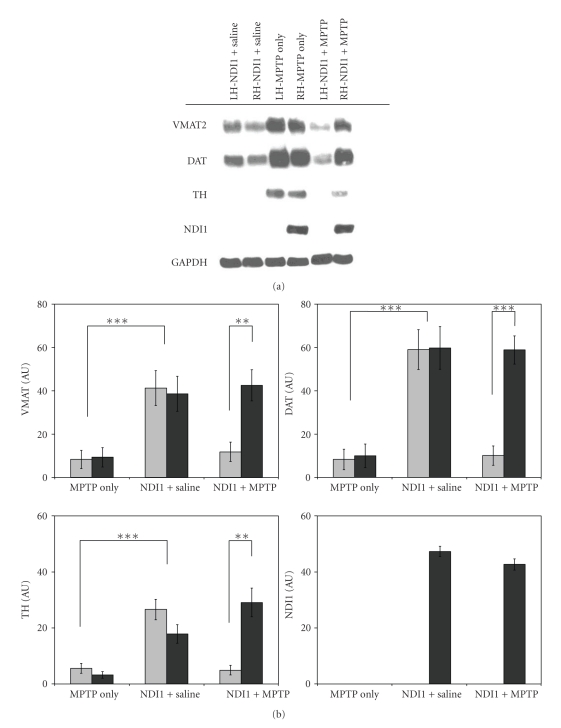
Figure 5.
Evaluation of MPTP effects on the DAergic neurons of the striatum using mouse brain homogenates. (a) Representative Western blots, 60 μg of protein per lane was loaded on a 10% SDS-PAGE gel, (b) statistical analysis of western blots for each treatment group MPTP Only (MO), NDI1 + Saline (NS), and NDI1 + MPTP (NM), VMAT2 (n = 7,7, 10), DAT (n = 8,8, 11), TH (n = 5,5,7), and NDI1 (n = 0,9, 13). ** = P < .005, *** = P < .00001. Light grey column, left hemisphere; dark grey column, right hemisphere.

