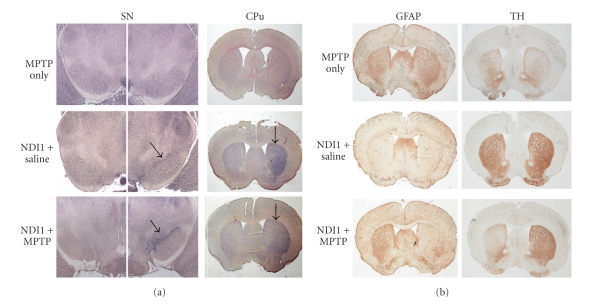
Figure 6.
Functional expression of NDI1 in the SN and CPu and protective effects following treatment with either saline or MPTP. Two weeks after the last injection, one-half of the mice were sacrificed for immunohistochemical analysis. (a) Representative NADH activity staining in the SN and CPu for each treatment group. Arrows in SN indicate the substantia nigra. Arrows in CPu indicate the injection side. (b) GFAP and TH levels in CPu.

