Figure 7.
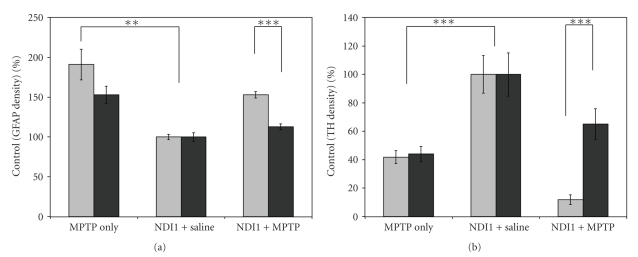
Statistical analysis of GFAP and TH staining density in the mouse striatum: a comparison between left and right hemisphere in MO, NS, and NM groups. Images with GFAP (n = 28) and TH (n = 35) immunostaining were collected and processed using the ImageJ software. (a) Density measurement of GFAP staining was evaluated for each hemisphere and compared to control (NDI1 + Saline, n = 10), results given as % control ± SEM (MPTP Only, n = 6; NDI1 + MPTP, n = 12). (b) The same procedure was used to evaluate TH density of each hemisphere, reported as % control ± SEM. (MPTP Only, n = 8; NDI1 + Saline, n = 12; NDI1 + MPTP, n = 15) ** = P < .005,*** = P < .0001. Light grey column, left hemisphere; dark grey column, right hemisphere.

