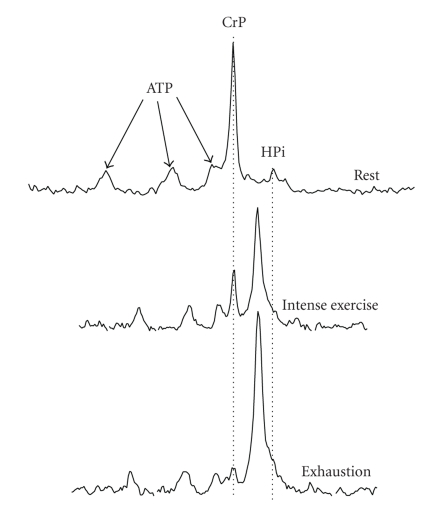
Figure 7.
The 31P MRS spectrum of resting muscle (top), muscle at near complete CrP depletion (middle), and muscle with complete CrP depletion (bottom). Note the decrease in CrP and increase in HPi as well as the resonance frequency shift of the HPi peak relative to CrP, indicating acidosis. The muscle pH of each condition is 7.01, 6.74, and 6.18, respectively. Based on unpublished research observations of the authors.

