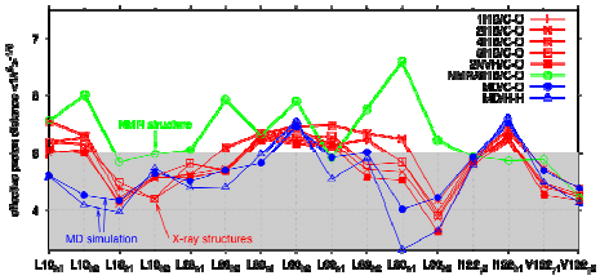
Figure 6.

NMR NOE analysis. The effective distance between water protons and the methyl protons of nonpolar residues lining the cavity is shown for the MD simulations with an empty nonpolar cavity (blue) using actual proton distances (open triangles) and methyl carbon-oxygen distances (filled circles). Also shown are results for five different crystal structures (red; curves labeled by the corresponding PDB codes) and the NMR structure (green) with only six water molecules, calculated by using the methyl carbon-oxygen distances. Lines are guides to the eye.
