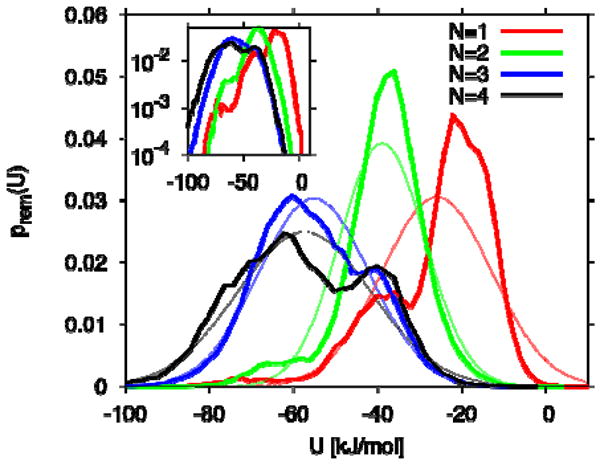
Figure 7.

Distribution of removal energies for water in the nonpolar cavity of IL-1β. Results are shown for N=1 to 4 (thick lines; curves peaking from right to left). Thin lines show the corresponding Gaussian distributions. The inset shows the distributions on a logarithmic scale.
