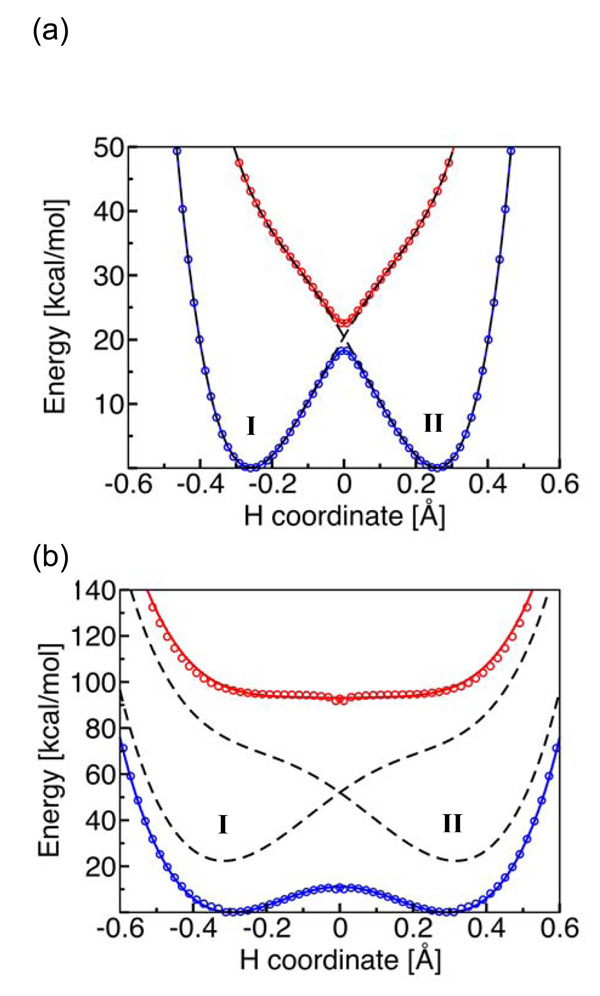
Fig. 10.
State-averaged CASSCF ground and excited state electronically adiabatic potential energy curves along the transferring hydrogen coordinate for (a) the phenoxyl/phenol and (b) the benzyl/toluene system. The coordinates of all nuclei except the transferring hydrogen correspond to the transition state geometry. The CASSCF results are depicted as open circles that are blue for the ground state and red for the excited state. The black dashed lines represent the diabatic potential energy curves corresponding to the two localized diabatic states I and II. The mixing of these two diabatic states with the electronic coupling Vel leads to the CASSCF ground and excited state electronically adiabatic curves depicted with solid colored lines following the colored open circles. For the phenoxyl/phenol system, the solid colored lines and the black dashed lines are nearly indistinguishable because the adiabatic and diabatic potential energy curves are virtually identical except in the transition state region. Figure and caption reprinted with permission from Ref. 69. Copyright 2006 American Chemical Society.

