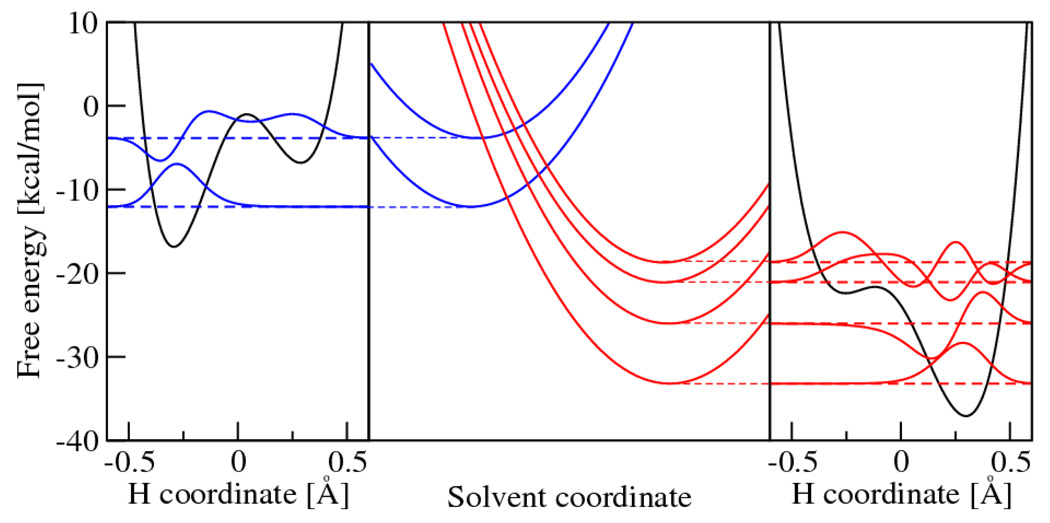
Fig. 4.
Calculated free energy curves for the PCET reaction in a rhenium-tyrosine complex. In the center frame are slices of the free energy surfaces along a collective solvent coordinate. In the left/right frames are the reactant/product proton potential energy curves and the corresponding proton vibrational wavefunctions along the proton coordinate. Figure reprinted with permission from Ref. 137. Copyright 2007 American Chemical Society.

