Abstract
Dynamic motions of human purine nucleoside phosphorylase in complex with transition state analogs and reactants were studied using 10 ns explicit solvent molecular dynamics simulations. hPNP is a homotrimer that catalyzes the phosphorolysis of 6-oxynucleosides. The ternary complex of hPNP includes the binding of a ligand and phosphate to the active site. Molecular dynamics simulations were performed on the ternary complex of six ligands including the picomolar transition state analogs, Immuclin-H (Kd = 56 pM), DADMe-Immucilin-H (Kd = 8.5 pM), DATMe-Immucilin-H (Kd = 8.6 pM), SerMe-Immucilin-H (Kd = 5.2 pM), the substrate insoine, and a complex containing only phosphate. Protein-inhibitor complexes of the late transition state inhibitors, DADMe-Imm-H and DATMe-Imm-H, are in flexible. Despite the structural similarity of SerMe-Imm-H to DATMe-Imm-H, the protein complex of SerMe-Imm-H is flexible and the inhibitor is highly mobile within the active sites. All inhibitors exhibit an increased number of nonbonding interactions in the active site relative to the substrate inosine. Water density within the catalytic site is much lower for DADMe-ImmH, DATMe-Imm-H, and SerMe-Imm-H than for the substrate inosine. Tight binding of the picomolar inhibitors results from increased interactions within the active site and a reduction in the number of water molecules organized within the catalytic site relative to the substrate inosine.
1 Introduction
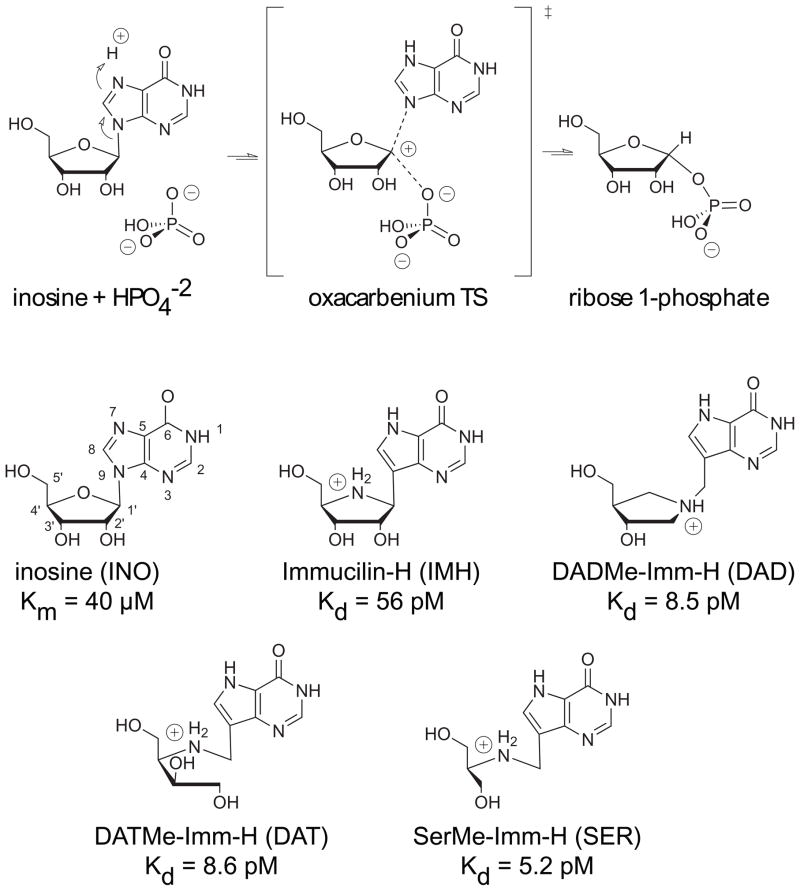
Human purine nucleoside phosphorylase (hPNP) catalyzes the reversible phosphorolysis of 6-oxynucleosides to a free nucleobase and ribose 1-phosphate, as shown for inosine in Fig. 1. A genetic deficiency of hPNP causes apoptosis in activated T-cells, making hPNP a promising target for the treatment of autoimmune disorders and T-cell cancers.1–3 Since transition state (TS) structures bind more tightly to the enzyme than ground state molecules, compounds that mimic the TS harness that binding energy.4 Our lab has successfully applied the theory of transition state inhibitor design to hPNP, resulting in the generation of several powerful picomolar inhibitors.4–7 A combination of experimentally measured kinetic isotope effects (KIEs) coupled with theoretical calculations was used to determine the TS structure of bovine PNP (bvPNP) and hPNP.8,9 Reaction of both hPNP and bvPNP occurs via an SN 1 reaction mechanism with transition states closely resembling a riboox-ocarbenium intermediate (Fig. 1). Reaction of the bvPNP passes through an early SN 1 transition state (TS) with minimal leaving group dissociation, the C1′ to N9 bond length was calculated to be 1.8 Å. 8 Bond cleavage at C1′ and N9 is more advanced in hPNP (calculated distance is 3.0 Å), which passes through a later oxacarbenium like TS.9
Figure 1.
PNP catalyzes the reversible phosphorylation of inosine to form ribose 1-phosphate and guanine. Reaction occurs via an SN 1 like mechanism through an oxacarbenium type transition state. Four generations of picomolar inhibitors have been designed to mimic the TS for PNP. Inhibitors include: Immuclin-H, DADMe-Imm-H, DATMe-Imm-H, and SerMe-Imm-H. Inosine is a substrate that is commonly used in experimental studies on PNP. Numbering of the substrate and inhibitors follows the nomenclature for nucleosides as shown for inosine above. The three letter code following each inhibitor is used for simplicity to represent the ligand and phosphate bound to hPNP.
A first generation of hPNP inhibitors called Immucilins was generated from the electronic and geometric properties of the bvPNP early TS structure (Immucilin-H shown in Fig. 1).6 Specifically, the protonated nitrogen group at N4 in the ribose of Immucilin-H imitates the cationic character at the TS. Additionally, protonation at N7 of the nucleobase of the inhibitors aids in tight binding of the ligands, imitating the protonation that occurs at the TSs of the PNPs. DATMe-Imm-H, a second generation inhibitor, contains a methylene bridge between the N1′ and N9 positions, structurally resembling the highly dissociated geometry of the late TS of hPNP.7,9 The cationic nitrogen of DATMe-Imm-H is synthesized at the 1′ position, more closely imitating the carbocation character of the TS. Consequently, DATMe-Imm-H exhibits a marked increase in binding efficiency to hPNP relative to Immucilin-H.7 Third and Fourth generation inhibitors, including DATMe-Imm-H and SerMe-Imm-H, have an Immucilin type scaffold similar to the TS of PNP, but are open ring structures that allow for flexibility of the inhibitor within the active site.5 The binding efficiency of DADMe-Imm-H, DATMe-Imm-H, and SerMe-Imm-H are similar (SerMe-Imm-H being slightly better), all binding an order of magnitude tighter than the first generation inhibitor Immucilin-H.
Structurally the four generations of inhibitors display parallel chemical functionality including: the protonated hypoxanthine nucleobase, the protonated nitrogen in the ring (or chain) of the sugar, and the 3′-OH of the ribose (Fig. 1). Differences in the chemical structure are proposed to cause an alteration in the mechanism of binding to hPNP.10–13 Chemical differences include the position of the protonated nitrogen, the number of hydroxyl groups, the methylene linker, and the cyclic versus acyclic sugar portion. Crystal structures of all four inhibitors show the binding interactions that occur in the active site pocket.14 However, the crystal structures display only minimal differences in the global conformations of the inhibitor bound complexes. Analysis of the static structures provide limited information of conformational dynamics suggested by different entropy factors for inhibitor binding to hPNP. The potency of these inhibitors begs one to discover the sources of binding efficiency.
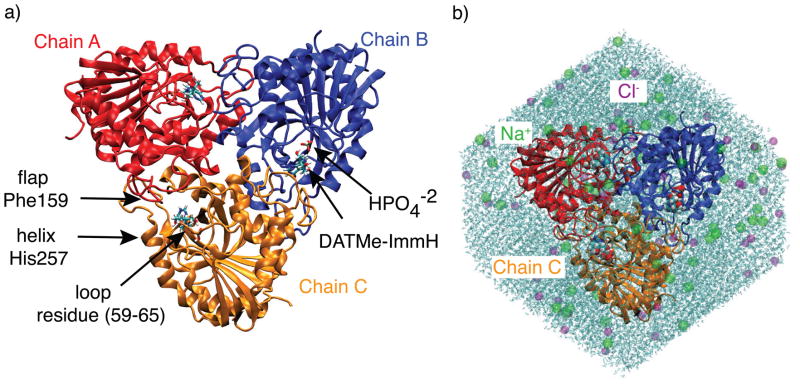
Each subunit of homotrimeric hPNP is composed of an α/β fold, which has arbitrarily been designated herein as chain A, B, and C (Fig. 2). The catalytic sites are located at the subunit interfaces. The ternary complex of hPNP includes the bound ligand and phosphate in the active site. Residue His257 is located at the tip of a helix that interacts with the 5′-hydroxyl of the substrate and plays an important role in catalysis.10,15,16 A flap containing contact residue, Phe159, is donated from an adjacent subunit into the active site, establishing communication between subunits upon ligand binding. Loop residues 59–65 sits near the phosphate binding portion of the pocket and is shown to be highly variable amongst the ligand complexes in the current study. The conformational differences between the inhibitor complexes were explored in 10 ns explicit solvent molecular dynamics simulations of the ternary complexes of the four generations of picomolar inhibitors - Immuclin-H, DADMe-Imm-H, DATMe-Imm-H, and SerMe-Imm-H - as well as the substrate inosine, which was used for comparison to experimental data (the model system used for the DATMe-Imm-H complex is shown in Fig. 2b). Inosine was modeled as the substrate and has been used for previous experimental studies.9,10 Under physiological conditions, the enzyme is inactivated upon binding of inhibitor at the first catalytic site.6 However, dynamics simulations were performed with three catalytic sites of hPNP occupied to be consistent with the crystal structures and binding isotope effect (BIE) studies.11,14 The ternary complexes are designated with a three letter code which represents the complex with ligand and phosphate bound to hPNP (Fig. 1). Numbering of the substrate and inhibitors follows the nomenclature for nucleosides as shown for inosine in Fig. 1. This dynamics study probes the link between inhibitor structure and protein dynamics by following the time-evolved fluctuations in the protein, inhibitors, and water density within the active site of each complex. Variations in the chemical structure of hPNP inhibitors exert varying effects on the dynamical motions of the protein.
Figure 2.
(a) The ternary complex of the hPNP homotrimer complexed with DATMe-Imm-H and . Subunits of hPNP are referred to as chain A, B, and C. The catalytic site is located at the interface of the subunits. A flap containing residue Phe159 extends from a neighboring subunit into the active site. An important residue in catalysis, His257, resides on a solvent exposed helix at the catalytic pocket. Residues 59–65 form a loop that lies near the phosphate binding site of the protein. (b) A model of DAT used for simulation includes DATMe-Imm-H and complexed to hPNP in an octahedral box of water. Charges were neutralized with NaCl at physiological concentration.
2 Methods
2.1 Building initial models for molecular dynamics simulations
Six initial models of hPNP bound to four transition state analogs with phosphate (the ternary complex), the substrate inosine with phosphate, and only phosphate were constructed based on the X-ray crystal structures. CHARMM’s subroutine HBUILD17 was employed to add all hydrogen atoms to the crystallographic heavy atoms. Two missing protein residues at the N terminus were also added using CHARMM.18 The protonation states of the titratable side chain groups in the enzyme were chosen based on their individual pKa values and consistent with solution pH of 7.0. The catalytic site His257 was initially built by assigning protonation at Nε as well as a second set of models using Nδ to determine the best protonation state for coordination to the substrates, in accordance with experimental results. Initially, all inhibitor complexes were built and equilibrated with the His257 residue protonated at Nδ, however, the interaction between inosine and His257 did not stay intact in any of the subunits during the simulations (unpublished results). To further test the protonation state of His257, all inhibitor-enzyme complexes were built with both protonation at either the Nδ and Nε to determine which protein state remained in contact with the 5′-OH of the inhibitor. The final structures of the four transition state analogs were built with His257 protonated at Nε so that Nδ could stabilize the O5′-hydroxyl of the ribose ring while the 5′ oxygen coordinates to the protonated nitrogen of the inhibitor. Both the inosine and phosphate only models were built with the His257 protonation at Nδ which shows hydrogen bonding to the 5′-OH of inosine. All of these models were then solvated in an octahedral box of water (TIP3P model19) with 8 Å minimum distance between the solute and the edge of the box, giving a final box dimension of 98.5 Å × 98.5 Å × 98.5 Å. Na+ and Cl− ions were added to the solvent box at physiological 150mM concentration to neutralize the systems. Each solvated system consists of about 70,000 atoms including the solute and the solvent molecules, the model is depicted in Fig. 2b.
2.2 Molecular dynamics simulation set up
We performed six molecular dynamics simulations in total. The CHARMM program18 version c35b3 and the all-atom CHARMM27/CMAP force field20,21 was used to perform all simulations. Missing ligand atom types and their associated parameters were assigned using MATCH (unpublished D. L. Price and C. L. Brooks III; J. Yesselman, J. L. Knight and C. L. Brooks III) and the CHARMM GENeralized Force Field (ligand force field parameters are made available as a supporting material).22 Equilibration and production dynamics was performed at constant temperature (300 K) using Langevin dynamics. The Langevin collision parameter of 10 ps−1 was chosen to couple the system to a 300 K heat bath. The SHAKE algorithm was employed to constrain the bonds involving hydrogen atoms.23 This allowed the use of a time step of 2 fs with the leapfrog integrator. All systems were simulated in periodic boundary conditions with the images generated by using the CRYSTAL module in CHARMM. Long-range electrostatic interactions were treated by using the PME method24 with a B-spline order of 6 and a Fast Fourier Transform grid of one point per Å and a real space gaussian-width kappa of 0.34 A. Real space and Lennard-Jones (LJ) interaction cut-offs of 10 Å were used with non-bond interaction lists maintained and heuristically updated out to 16 Å. The migration of the solute protein outside the primary solvent box was discouraged by weak (1.0 kcal/mol/Å2) center-of-mass translational and rotational restraints by using the MMFP module of CHARMM.25
2.3 Molecular dynamics protocol
All initial models were subjected to stepwise minimizations to remove steric clashes between protein atoms and water molecules. First, initial structures solvated in a 150 mM NaCl solvent box were minimized for 1000 steepest descent (SD) steps followed by 2000 ABNR (Adopted basis Newton Raphson) steps keeping all heavy atoms fixed and allowing only water and added ions harmonically restrained with 0.1 kcal/mol.Å2 to relax. Following, all models were further minimized for 2000 SD steps with 50 kcal/mol.Å2 harmonic restraints on all solute heavy atoms only. Then, the harmonic restraint force was lowered to 10 kcal/mol.Å2 for the transition state analogs, phosphate and His257 residues to retain their position as in crystal structure, while the protein and water molecules and ions were minimized further with no restraints for 2000 steepest descent and 10000 ABNR steps until a convergence in RMS gradient of 0.001 kcal/mol Å was achieved. All well minimized structures were equilibrated by performing NVT MD simulations at 300 K for 200 ps while still keeping 10 kcal/mol.Å2 harmonic restraints on the transition state analogs, phosphate and His257 residues. In the final equilibrated structures interactions between transitions state analogs/phosphate and catalytic site His257 residues remain intact as observed in the crystal structures. Finally, starting from the equilibrated structures the production dynamics was performed at constant temperature and volume for total simulation length of 10 ns at 300 K without any restraints on the systems.
3 Results and Discussion
3.1 Conformational changes in the hPNP structures bound to different TS inhibitors
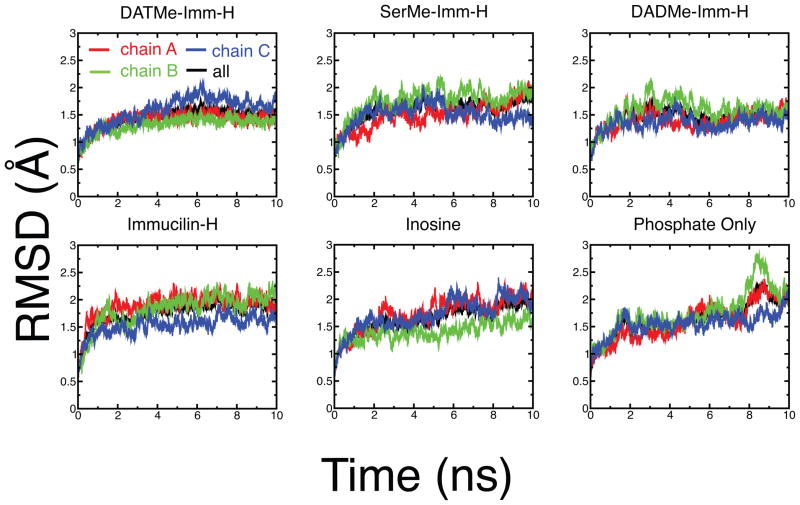
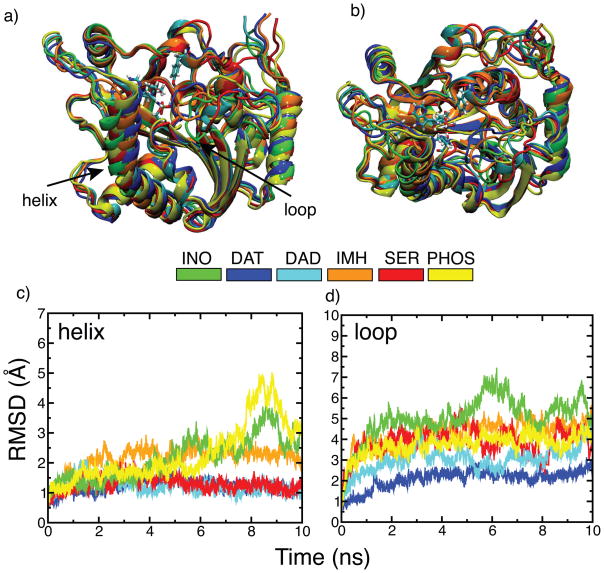
Global protein dynamics in PNP has been linked to the formation of the transition state.16 Structural analysis of the crystal structures of TS analogs bound to hPNP reveals no global conformational differences between most structures, except for small differences in SER and DAD (Fig. 3a). In SER and DAD, the structural differences are located in the loop region (residues 59–68) and both structures superimpose with overall backbone root mean square deviation (RMSD) of 1.2 Å and 0.8 Å with respect to the substrate bound crystal structures, respectively. Surprisingly, crystal structures bound to IMH, DAD, and PHO superimpose with zero RMSD with respect to the substrate bound crystal structures (see Fig. 3a). Conformational changes of the ligand enzyme complexes of hPNP were followed by measuring the RMSD of the protein from their respective starting crystal conformations (Fig. 4). In contrast to the crystal structure analysis, superposition of the average structures from the last 500 ps of 10 ns MD simulations reveal subtle conformational differences in the protein structures despite the similarity in the chemistry of the inhibitors (Fig. 3b). Most of these conformational differences are concentrated in the helix (residues 256–268) and the loop residues (residues 59–68) of hPNP (Fig. 5). RMSD for each individual chain of the loop and helix segments is available in the supporting information Fig. S1.
Figure 3.
Global conformational differences in the crystal structures bound to different ligands before and after 10 ns simulations. a) Superimposed X-ray structures bound to different ligands. b) Superimposed average simulated structures from the last 500 ps of 10 ns molecular dynamics simulations. Notice the large conformation rearrangements in the helix and loop regions of the simulated structures.
Figure 4.
Time evolution of the backbone RMSD of complete hPNP homotrimer as well as each individual chain of the homotrimer bound to the different ligands. Each structure was superimposed with respect to the backbone atoms of their equilibrated starting structures.
Figure 5.
Dynamical changes observed in the helix and loop residues of hPNP homotrimer during 10 ns simulations in the presence of different ligands. a) Side-view of one of the chains for each inhibitor bound structure superimposed with respect to the INO simulated structure (green). Backbone atoms of the average simulated structures obtained from the last 500 ps of 10 ns dynamics runs were used for superimposition. b) Top-view of the same superimposed structures. c) Backbone RMSD of only helix residues (256–268) of all three chains of the hPNP homotrimer bound to different ligands after aligning strutures on all backbone atoms of the hPNP. d) Backbone RMSD of only loop residues (59–68) for all three chains of the hPNP homotrimer after aligning structures on all backbone atoms of the hPNP. RMSD of the helix and loop segments for the individual chains of all complexes is available in the supporting information Fig. S1.
As shown in Fig. 5b, hPNP conformations with INO and PHO are quite flexible compared to the inhibitor complexes, consistent with the reported difficulty of crystallizing PNP structures in the absence of TS analogs.26 Time evolution of RMSD from the crystal structures of the four TS analog bound structures shows that IMH is the most flexible while DAT is the least flexible (Fig. 5b and 5c). RMSD of both the helix and loop residues in DAT stay within 1.5 Å of the starting crystal conformation during 10 ns simulations. However, in IMH the helix and the loop residues depart significantly from their starting crystal conformation. The global conformations of hPNP bound to DAD and SER have an intermediate flexibility between that of IMH and DAT, the helix residues showing a small RMSD from the starting structures, but a large deviation in the loop residues. These differences in the conformation of helix and loop residues in the varying inhibitor bound states of hPNP show a diversity in protein conformation that results from changes in the chemical structure of the transition state mimics.
3.2 Structural fluctuations of inhibitor-enzyme complexes
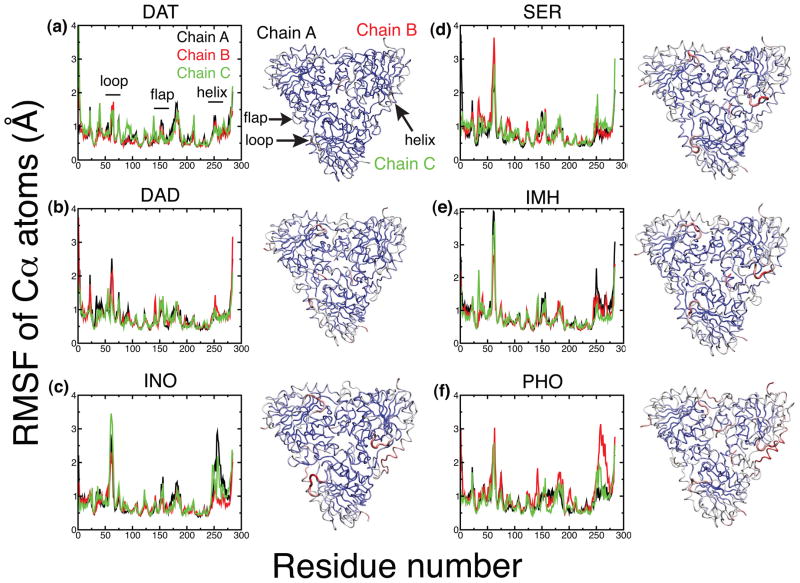
An analysis of the root mean square fluctuations (RMSF) for all six of the enzyme complexes show regions of high flexibility in the protein complexes including loop residues 59–65, helix 256–268 (shown as helix His257), and flap 158–164 (shown as flap Phe159) (Fig. 6). An average RMSF for these regions, as well as an average of the Cα RMSF for residues 8 to 275 (Table 1, the floppy ends of the protein were excluded from the average) show the highest degree of flexibility in the region of loop 59–65. Surprisingly, the INO, IMH and SER complexes all show more flexibility in this region than the hPNP complexed with only phosphate (PHO). The late transition state mimics DAT and DAD, exhibit decreased flexibility in the loop relative to PHO. Loop 59–65 of DAT closes over the catalytic site, and is held tightly by an interaction of His257 with His64 in two of the subunits and His257 to Pro62 in the third; average distances between these residues in each chain are 2.33 Å, 2.50 Å, and 2.96 Å respectively. In DAD, two of the subunits are flexible with weak interactions to neighboring loops, while one subunit is tightly held by an interaction of Ser59 and Thr60 to Glu89 (distance 1.80 Å). Flap 158–164 is donated to the catalytic site from a neighboring subunit, and shows a moderate decrease in fluctuation in all ligand complexes relative to PHO. Once the inhibitor is bound this flap stays fairly rigid and Phe159 remains in close contact with the inhibitors. The RMSF of helix 256–268 decreases upon binding for all of the ligand-enzyme complexes relative to PHO. Additionally, all four inhibitor complexes show decreased flexibility relative to INO, indicating that this interaction is important for tight binding. The origin of protein flexibility for each inhibitor varies. Decreased flexibility in DAT is a result of strong interactions of two of the hydroxyl groups of the inhibitor with His257. For DAD and SER, only one of the subunits of the trimer maintains an interaction of His257 with one of the inhibitor hydroxyls. Flexibility of the helices in the other two subunits is slightly increased, but the subunits are more rigid than PHO. RMSF average values for chain, loop, and flap segments in each subunit of all six enzyme inhibitor complexes are included in the supporting information Fig. S2.
Figure 6.
Cα root mean square fluctuations (RMSF) in Å of three chain of the hPNP homotrimer for all ligand complexes. Loop regions are flexible in SER, IMH, INO, and PHO. The helix His257 regions are relatively rigid in DAT, SER, and DAD in comparison with other complexes. In general, fluctuations in DAT are dampened relative to the other ligand complexes. With the exception of DAT, all complexes have at least one chain that is more rigid than the other subunits. Graphical representations of the Cα RMSF of each protein-ligand complexes is shown to the left of each plot. Red segments are highly flexible, white segments displays intermediate flexibility, and the blue segments are rigid.
Table 1.
| loop 59–65 | flap 158–164 | helix 256–268 | avg Cα all residues | |
|---|---|---|---|---|
| DAT | 1.16 | 0.56 | 0.82 | 0.71 |
| SER | 2.23 | 0.61 | 0.88 | 0.80 |
| DAD | 1.53 | 0.66 | 0.79 | 0.74 |
| IMH | 2.60 | 0.63 | 1.00 | 0.81 |
| INO | 2.32 | 0.61 | 1.34 | 0.80 |
| PHO | 1.96 | 0.82 | 1.63 | 0.92 |
The average Cα RMSF for the entire homotrimer show the highest flexibility in the native protein with only phosphate bound in the active site (PHO) and the flexibility decreases when inosine is bound (Table 1, column 4). The overall protein flexibility of both the IMH and SER inhibitors is similar to INO. This is surprising since the unbound IMH inhibitor is more rigid in solution and the SER inhibitor is inherently more flexible. In contrast, both late transition state inhibitors, DAT and DAD, show less flexibility than the other ligand complexes. Decreased flexibility in only the late transition state inhibitor complexes is of interest to our understanding of protein dynamics in hPNP and this will be discussed in the section 3.4 analyzing active site interactions.
3.3 Structural fluctuations of bound inhibitors
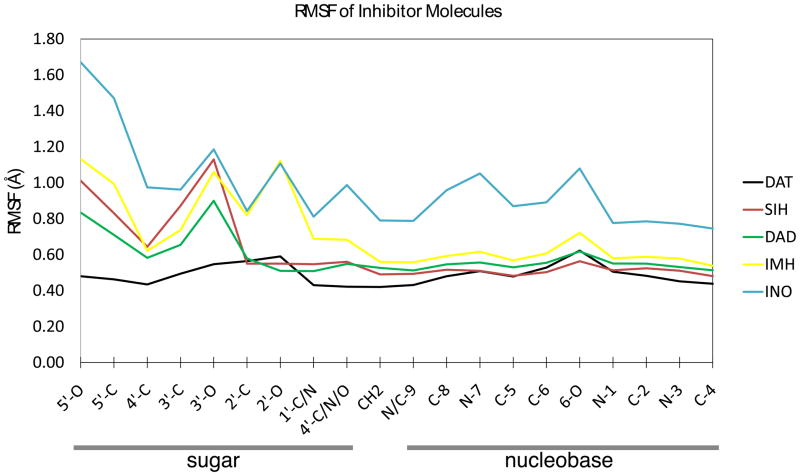
Ligand flexibility is reduced upon binding to an enzyme in comparison to free solution. The average RMSF for the ligands bound to hPNP in order of decreasing flexibility is INO > IMH > SER > DAD > DAT, RMSF averages of the heavy atoms are 0.92, 0.69, 0.66, 0.58, 0.49 respectively. All of the inhibitors show less flexibility than the INO substrate. An interesting correlation exists between the flexibility of the inhibitor and the flexibility of the protein. For each complex, the ligand with the lowest flexibility corresponds to the most rigid subunit of the protein. Ligand flexibility is parallel to the trend shown earlier for protein flexibility, INO ~ IMH ~ SER > DAD > DAT. Simulations show that dynamic motions of the protein are coupled to ligand binding in the active site. Average RMSF values for all of the ligands and the corresponding Cα RMSF of the protein for each of the individual subunits is included in the supporting information Fig. S3.
Atomic fluctuations of all heavy atoms in the inhibitor were analyzed by calculating the average RMSF (Fig. 7). Inosine, the most flexible ligand, exhibits flexibility in both the sugar and nucleobase portions of the molecule. The nucleobase groups of all inhibitor complexes are more rigid than the INO substrate complex, but is least pronounced in IMH. Increased nucleobase rigidity of the inhibitors relative to inosine is attributed to protonation at N7, creating an extra hydrogen bond contact to Asn243 that anchors the nucleobase into the active site. The cyclic inhibitors IMH and DAD display fluctuations at the 2′-O and 3′-O, reflecting ring pucker from the 2′-endo to 3′-endo conformations of the ribocation mimic in the active site. SER shows flexibility in the acyclic alcohol fragment which is expected from the inherent flexible structure of SER. Despite the flexibility of DAT in solution, the bound inhibitor shows the highest rigidity in the alkyl hydroxy functional groups than all other ligands. Interactions between both the 2′-OH and the 3′-OH of DAT with His257 in all 3 subunits is responsible for the rigidity of the inhibitor.
Figure 7.
The average heavy atom RMSF of the bound ligands. Each number is the average RMSF of all three ligands bound to the hPNP homotrimer.
BIEs of unprecedented magnitude have been reported for inhibitors of hPNP.11 A BIE results from decreased conformational flexibility, geometric distortions, and changes in bond polarization to a ligand upon binding into the catalytic site.27 Experimentally measured 5′-3H BIEs for inosine, Immucilin-H, and DADMe-Imm-H are 1.015(3), 1.126(5), and 1.292(12) respectively. Analysis of atomic fluctuations at the 5′-O and 5′-C positions of each of these inhibitors show a trend of decreasing flexibility INO > IMH > DAD, consistent with the magnitude of the BIE measurements. Structural fluctuations vary drastically for the inhibitors, the greatest contrast is seen between DAT and SER-which only vary by the addition of one methylene hydroxyl group. DAT is rigid when bound to hPNP and SER remains flexible. The time-series of a common dihedral angle depicting flexibility of all inhibitors is shown in the supporting information Fig. S4.
3.4 Interactions of inhibitors with active site residues
The coupling of protein fluctuations with binding site interactions is important for understanding the picomolar affinity of these inhibitors. Crystal structures of inhibitor complexes to hPNP provide a static view of the interactions.14 From the crystal structures, interaction energies were attributed to: ion-pairing of the inhibitor with phosphate; interactions of the nucleobase with neighboring residues; interaction of phosphate with the hydroxyl groups of the sugar; and the interaction of His257 with the 5′-OH of the ligands. Both theoretical and experimental studies suggest that the interaction of 5′-OH with His257 is important for the tight binding of the inhibitors.10,15 Experiments show a change in the BIE for the 5′-OH of inosine upon mutation of His257. Mutation of His257 also causes a decrease in the binding affinity of IMH, DAD, and INO, though the effect on DAD is minimal.10 The indirect participation of His257 in bond cleavage at the transition state has been implicated in theoretical studies using transition path sampling.28
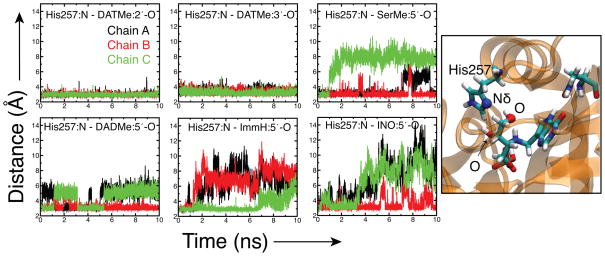
Distance versus time plots show the interaction between Nδ of His257 and the oxygen of the nearest hydroxyl group of the ligands (Figure 8, 5′-OH for all ligands with the exception of DAT). DAT is the only ligand that maintains two hydroxyl interactions with His257, strongly contributing to both the rigidity of the DAT inhibitor and the arrested state of the protein in all three subunits. The chemical structure of SER is similar to DAT, but it lacks the 2′-methylene hydroxyl group. One of the hydroxyl groups of SER binds with His257 and the other with phosphate. Interaction of the 5′-OH of SER with His257 is maintained in two of the subunits, however, this interaction shows more variation and suggests a highly flexible association. Interactions with His257 reduce the flexibility of the helix in chain A and B in SER. (Fig. 6). However, loop 59 to 65 is very flexible in all subunits of SER. Only one subunit of DAD shows an interaction of His257 with the inhibitor, in spite of this the inhibitor and protein and ligand are fairly in flexible due to compensating interactions with Phe159. Hydrogen bonding interactions between His257 and IMH are lost in all subunits at the end of the 10 ns simulation. Interactions with other residues, namely Thr242 and Phe159, compensate for loss of hydrogen bonding with His257. Interaction between His257 and the 5′-OH of inosine holds for one of the subunits of INO, however, the interaction is relatively weak in comparison to some of the inhibitors and fluctuates throughout the simulation. Loss of inosine hydrogen bonds with His257, cause the helices in the other two subunits to fluctuate nearly as much PHO (Fig. 6). Interaction with His257 can be crucial for high binding affinity, as shown in DAT, however other interactions can compensate for a weak interaction with the His257 residue.
Figure 8.
Time evolution of distance between Nδ of His257 with the nearest hydroxyl group of each ligand. The figure shows an example of this interaction in DAT. Nδ on His257 hydrogen bonds to the 2′ - and 3′-hydroxyls of the inhibitor.
Plots of the average distance between the ligands and important contact residues within the active sites is shown next to the averaged structures (Fig. 9). Groups absent in specific structures are given a zero value. Thr242 is shown on the plots, but is absent in the figures for clarity. A representation of the active site of INO including Thr242 is included in the supporting information Fig. S5. Average hydrogen bonding distances between the nucleobase and active site residues Glu201 and Asn243 are tighter in all of the inhibitor complexes than in the substrate INO. Weak binding of inosine is probably caused by the deprotonated state of N7, and the missing hydrogen bond to the carbonyl oxygen of Asn243, causing a loose fit in the nucleobase binding pocket. Tight anchoring of the nucleobase within the active site is important to the free energy of binding of these transition state mimics since a protonated 9-deazahypoxanthine is synonymous with all four of these picomolar inhibitors and similar analogs with hypoxanthine bind weakly.29 This confirms the early hypothesis involved in designing these inhibitors, that protonation at N7 occurs at the transition state, and a mimic protonated at N7 would cause tight binding of the inhibitor.
Figure 9.
Snapshots of the binding site of each ternary complex depicting the ligand, phosphate, and important interactions with neighboring residues taken from the simulated structures averaged over the last 500 ps of MD simulations. Plots of the average distance between the inhibitor atom and a heavy atom of the protein residues within hydrogen bonding distance for each chain of the complexes. The 2′-OH is absent from DAT and H7 is absent on INO, these distances are set as zero value. Interactions are best maintained in the late TS inhibitors DAT and DAD. A chemical representation of the binding site shows the interactions of INO with neighboring residues represented in the distance plots. Interaction between Thr242 and the inhibitors is shown in the distance plots, but is absent in the snapshots of the active site for clarity.
Binding of the inhibitor with neighboring residues in the active site is similar for the late transition state inhibitors DAT and DAD, though DAD is slightly more loose in two of the subunits. For both DAT and DAD the 5′-OH is in close proximity to His257 and Phe159, both have moderate bonding of the 3′-OH to Tyr88, and both have a strong ionic interaction with phophate in all three subunits. Binding in the sugar moiety of IMH and INO is more complex than a simple interaction of the 5′-OH with His257. Depending upon the subunit, the 5′-OH also coordinates to other residues in the active site, namely Thr242, Phe159, and phosphate. Conformational changes in ring puckering are probably the cause for minimal bonding to Tyr88 in IMH and INO, though this occurs to a lesser extent in IMH (Fig. 6). Prominent interactions in the acyclic hydroxyl portion of the SER inhibitor include 5′-OH with His257 and the 2′-OH with phosphate. In summary, the late transition state inhibitors create better contacts with neighboring residues in the three site binding model relative to IMH, SER, and INO. The inherently flexible chemical structure of DAT allows the inhibitor to make small adjustments to maintain strong contacts within the active site; in contrast, the rigid structure of the IMH inhibitor cannot extend and retract to maintain important interactions with neighboring residues.
3.5 Role of water in hPNP dynamics
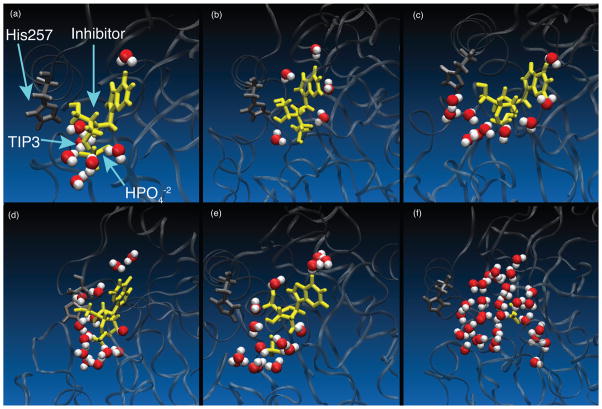
Molecular dynamics simulations of the inhibitor complexes were performed in an octahedral box of water with 8 Å minimum distance between the solute and the edge of the box. The water density of each complex was calculated by determining the number of water molecules within 3.5 Å of the ligand in the equilibrated structure after 10 ns simulations (Table 2). The number of water Table 2 molecules present in the catalytic pocket for each subunit table is significantly increased relative to the crystallographic waters (Table 2). An increase of water is especially prominent in the highly flexible IMH and INO structures. Fig. 10 illustrates the water content for a single active site within each of the simulated inhibitor complexes. All of the ligand-complexes show a lower water density than the empty pocket containing only phosphate (Fig. 10). The active site with inosine is highly solvated, ranging from 6–16 molecules of water in the catalytic site of each subunit. Upon binding, all inhibitor complexes exclude more water from the active sites than does substrate (INO). Catalytic sites of IMH are more solvated (6–10 water molecules) than the more tightly closed catalytic sites of DAT (4–5 water molecules) (see Table 2). Exclusion of water from the active site of DAT is caused by the tightly closed state of the protein upon binding of inhibitor, specifically the tight contact of loop 59 to 65 with helix His257. The dampened motions of the DAD protein structure is consistent with limited movement of water molecules in and out of the pocket. Despite the flexibility of the SER protein structure the number of water molecules found in the pocket is relatively low. Contacts that close the pocket of SER must remain intact, though highly flexible, shielding the inhibitor from solvent. Also, the surface area of the inhibitor in SER is smaller than the other ligands and the 3.5 Å cut-off for measuring water density includes less of the water molecules within the binding sites compared to other ligands. The tightest binding inhibitors SER, DAT, and DAD all displace several water molecules from the active site pocket upon binding.
Table 2.
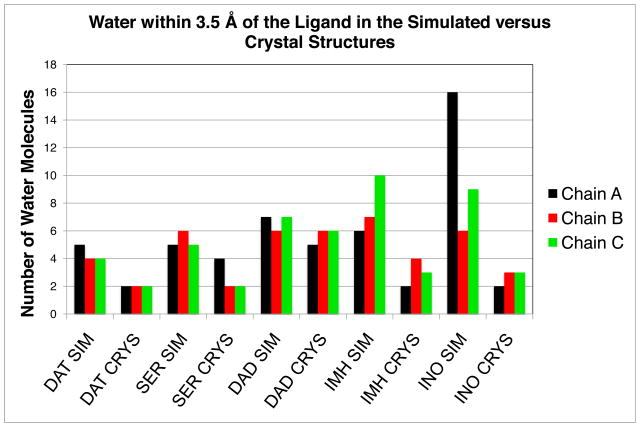 |
Figure 10.
Snapshots of the binding site for each ternary complex after 10 ns simulations showing the water density within 3.5 Å of the ligand and phosphate - (a) DAT (b) SER (c) DAD (d) IMH (e) INO (f) PHO. Water density of PHO was computed arbitrarily for a graphical comparison and is not an analytical representation. The number of water molecules in the catalytic site for each system is listed in Table 2.
Movement of water into the active site of bound hPNP follows variable pathways, and a correlation to a particular loop or residue movement was not found in the analysis. For the substrate INO, water movement from bulk solvent is channeled into the pocket through a loop near N7 of the nucleobase. This extra mode of entry for water into INO contributes to the excess water density of the substrate versus inhibitor complexes. Water in the region of N7 is important for the protonation of inosine in the mechanism of hPNP. The inhibitor complexes are already protonated at N7 upon binding and interaction with Asn243 probably blocks this pathway. Displacement of water upon binding of the ligand contributes favorably to the entropy term of the binding energy. Analysis of the simulated structures helps explain the large entropic penalty of IMH binding.12
4 Conclusions
Variations in the mechanism of binding TS analog inhibitors is remarkable considering the small variations in chemical structure and similar dissociation constants (5 to 56 pM). Molecular dynamics simulations in explicit water provide insights in the time domains between those from crystal structures and QM barrier crossing studies.14,28 Simulations show that the TS inhibitor complexes DAT and DAD are more rigid than the other ligand complexes. Ligand-induced rigidity is caused by increased interactions of the inhibitors with active site residues. Even though DAT and SER ligands vary by only one methylene hydroxyl group, these complexes show significantly different binding mechanisms. The SER protein complex is flexible and the bound inhibitor moves within the binding pocket. Interactions of SER are tighter for one subunit of the trimer and less tight in the other two subunits. Despite the motion in SER, it is the most powerful inhibitor in kinetic experiments (Kd = 5.2 pM). As only one site of PNP needs to be filled to cause inhibition,6 one-site analysis is implicated for future work. The IMH complex is flexible with fewer interactions in the catalytic site than the other inhibitors. One of the consequences of the arrested state of DAT is that few waters enter the catalytic sites of the homotrimer; in contrast, IMH exhibits relatively hydrated active sites. Assuming that the TS analog complexes are close to the geometry needed for barrier crossing in the PNP chemical reaction, the dynamic probability that INO will achieve a geometry similar to that of the TS complexes is low and consistent with the high chemical barrier (~159 s−1).30 In conclusion, the binding affinity of the inhibitors is attributed to increased interactions within the active site relative to the substrate inosine as well as decreased water density in the active sites.
Supplementary Material
Figure S1 Time evolution of the backbone RMSD of helix and loop for each subunit of the hPNP homotrimer. Each structure was superimposed with respect to the backbone atoms of their equilibrated starting structures.
Figure S2 Average RMSF all hPNP ligand complexes - DAT, SER, DAD, IMH, INO, and PHO. The first three columns contain the average RMSF of loop 59–65 (blue), flap Phe159 (red), and helix His257 (green) respectively, for each individual subunit of the protein.
Figure S3 Total average RMSF for each inhibitor (blue) and the total average Cα RMSF of the protein subunit it is bound. Notice, the flexibility of the inhibitor parallels the flexibility of the protein subunit.
Figure S4 Time evolution of a crucial dihedral angle common to all the inhibitors bound to hPNP. The dihedral angle analyzed is between the methylene hydroxy that interacts with His257 and the 4′C and 4′O/N/C. For example, the dihedral angle for inosine is defined by 5′O-5′C-4′C-4′O. The dihedral angle for the DAT inhibitor is defined by 3′O- 3′C-4′C-4′N. Fluctuations in the same dihedral angle of SER, IMH, and INO shows the flexibility of the ligands in the active site.
Figure S5 A snapshot of the inosine active site shows the 5′-OH of inosine hydrogen bonding with Thr242.
Acknowledgments
We thank Dr. Jennifer. L. Knight and Mr. Joseph Yesselman for providing CHARMM topology and parameters of all ligands. CLB acknowledges research support by the National Institutes of Health through the Center for Multi-Scale Modeling Tools for Structural Biology (grant RR012255). This work was supported by National Institutes of Health Grant GM068036.
List of Abbreviations
- MD
molecular dynamics
- hPNP
Purine nucleoside phosphorylase
- BIE
Binding isotope effect
- KIE
Kinetic isotope effect
- TS
Transition state
- RMSF
root mean square fluctuations
- RMSD
root mean square deviation
Footnotes
Topology files and force field parameters for all ligands is made available as supporting material with this manuscript. This material is available free of charge via the Internet at http://pubs.acs.org
References
- 1.Giblett ER, Ammann AJ, Wara DW, Sandman R, Diamond LK. Lancet. 1975;1:1010. doi: 10.1016/s0140-6736(75)91950-9. [DOI] [PubMed] [Google Scholar]
- 2.Ealick SE, Babu YS, Bugg CE, Erion MD, Guida WC, Montgomery JA, Secrist JA. Proc Natl Acad Sci USA. 1991;88:11540. doi: 10.1073/pnas.88.24.11540. [DOI] [PMC free article] [PubMed] [Google Scholar]
- 3.Schramm VL. Biochim Biophys Acta. 2002;1587:107. doi: 10.1016/s0925-4439(02)00073-x. [DOI] [PubMed] [Google Scholar]
- 4.Schramm VL. J Biol Chem. 2007;282:28297–300. doi: 10.1074/jbc.R700018200. [DOI] [PubMed] [Google Scholar]
- 5.Clinch K, Evans GB, Frohlich RFG, Furneaux RH, Kelly PM, Legentil L, Murkin AS, Li L, Schramm VL, Tyler PC, Woolhouse AD. J Med Chem. 2009;52:1126–1143. doi: 10.1021/jm801421q. [DOI] [PMC free article] [PubMed] [Google Scholar]
- 6.Miles RW, Tyler PC, Furneaux RH, Bagdassarian CK, Schramm VL. Biochemistry. 1998;37:8615–21. doi: 10.1021/bi980658d. [DOI] [PubMed] [Google Scholar]
- 7.Evans GB, Furneaux RH, Lewandowicz A, Schramm VL, Tyler PC. Journal of Medicinal Chemistry. 2003;46:5271–5276. doi: 10.1021/jm030305z. [DOI] [PubMed] [Google Scholar]
- 8.Kline PC, Schramm VL. Biochemistry. 1993;32:13212. doi: 10.1021/bi00211a033. [DOI] [PubMed] [Google Scholar]
- 9.Lewandowicz A, Schramm VL. Biochemistry. 2004;43:1458–1468. doi: 10.1021/bi0359123. [DOI] [PubMed] [Google Scholar]
- 10.Murkin AS, Birck MR, Rinaldo-Matthis A, Shi W, Taylor EA, Almo SC, Schramm VL. Biochemistry. 2007;46:5038–49. doi: 10.1021/bi700147b. [DOI] [PMC free article] [PubMed] [Google Scholar]
- 11.Murkin AS, Clinch K, Tyler PC, Schramm VL. J Amer Chem Soc. 2008;130:2166–67. doi: 10.1021/ja7104398. [DOI] [PubMed] [Google Scholar]
- 12.Edwards AA, Mason JM, Clinch K, Tyler PC, Evans GB, Schramm VL. Biochemistry. 2009;48:5226–38. doi: 10.1021/bi9005896. [DOI] [PMC free article] [PubMed] [Google Scholar]
- 13.Edwards AA, Tipton JD, Brenowitz MD, Emmett MR, Marshall AG, Evans GB, Tyler PC, Schramm VL. Biochemistry. 2010;49:2058–67. doi: 10.1021/bi902041j. [DOI] [PMC free article] [PubMed] [Google Scholar]
- 14.Ho MC, Shi W, Rinaldo-Matthis A, Tyler PC, Evans GB, Clinch K, Almo SC, Schramm VL. Proc Natl Acad Sci USA. 2010;107:4805–12. doi: 10.1073/pnas.0913439107. [DOI] [PMC free article] [PubMed] [Google Scholar]
- 15.Saen-Oon S, Quaytman-Machleder S, Schramm VL, Schwartz SD. Proc Natl Acad Sci USA. 2008;105:16543–8. doi: 10.1073/pnas.0808413105. [DOI] [PMC free article] [PubMed] [Google Scholar]
- 16.Schwartz SD, Schramm VL. Nat Chem Biol. 2009;5:551–8. doi: 10.1038/nchembio.202. [DOI] [PMC free article] [PubMed] [Google Scholar]
- 17.Brunger AT, Karplus M. Proteins Struc Func Genet. 1988;4:148–156. doi: 10.1002/prot.340040208. [DOI] [PubMed] [Google Scholar]
- 18.Brooks BR, et al. CHARMM: The Biomolecular Simulation Program. 2009 doi: 10.1002/jcc.21287. [DOI] [PMC free article] [PubMed] [Google Scholar]
- 19.Jorgensen W, Chandrashekar J, Madura J, Impey R, Klein M. J Chem Phys. 1983;79:926–935. [Google Scholar]
- 20.MacKerell AD, Jr, et al. J Phys Chem B. 1998;102:3586–3616. doi: 10.1021/jp973084f. [DOI] [PubMed] [Google Scholar]
- 21.MacKerell AD, Jr, Feig M, Brooks CL., III J Amer Chem Soc. 2004;126:698–699. doi: 10.1021/ja036959e. [DOI] [PubMed] [Google Scholar]
- 22.Vanommeslaeghe K, Hatcher E, Acharya C, Kundu S, Zhong S, Shim J, Darian E, Guvench O, Lopes P, Vorobyov I, Mackerell AD. Journal of computational chemistry. 2010;31:671–90. doi: 10.1002/jcc.21367. [DOI] [PMC free article] [PubMed] [Google Scholar]
- 23.Ryckaert JP, Ciccotti G. J Chem Phys. 1983;78:7368–7374. [Google Scholar]
- 24.Darden TA, York DM, Pedersen LG. J Chem Phys. 1993;98:10089–10092. [Google Scholar]
- 25.Beglov D, Roux B. J Chem Phys. 1994;100:9050–9063. [Google Scholar]
- 26.Erion MD, Takabayashi K, Smith HB, Kessi J, Wagner S, Hönger S, Shames SL, Ealick SE. Biochemistry. 1997;36:11725–34. doi: 10.1021/bi961969w. [DOI] [PubMed] [Google Scholar]
- 27.Schramm VL. Curr Opin Chem Biol. 2007;11:529–36. doi: 10.1016/j.cbpa.2007.07.013. [DOI] [PMC free article] [PubMed] [Google Scholar]
- 28.Saen-Oon S, Ghanem M, Schramm VL, Schwartz SD. Biophys J. 2008;94:4078–88. doi: 10.1529/biophysj.107.121913. [DOI] [PMC free article] [PubMed] [Google Scholar]
- 29.Lewandowicz A, Ringia EAT, Ting LM, Kim K, Tyler PC, Evans GB, Zubkova OV, Mee S, Painter GF, Lenz DH, Furneaux RH, Schramm VL. J Biol Chem. 2005;280:30320–8. doi: 10.1074/jbc.M505033200. [DOI] [PubMed] [Google Scholar]
- 30.Ghanem M, Zhadin N, Callender R, Schramm VL. Biochemistry. 2009;48:3658–68. doi: 10.1021/bi802339c. [DOI] [PMC free article] [PubMed] [Google Scholar]
Associated Data
This section collects any data citations, data availability statements, or supplementary materials included in this article.
Supplementary Materials
Figure S1 Time evolution of the backbone RMSD of helix and loop for each subunit of the hPNP homotrimer. Each structure was superimposed with respect to the backbone atoms of their equilibrated starting structures.
Figure S2 Average RMSF all hPNP ligand complexes - DAT, SER, DAD, IMH, INO, and PHO. The first three columns contain the average RMSF of loop 59–65 (blue), flap Phe159 (red), and helix His257 (green) respectively, for each individual subunit of the protein.
Figure S3 Total average RMSF for each inhibitor (blue) and the total average Cα RMSF of the protein subunit it is bound. Notice, the flexibility of the inhibitor parallels the flexibility of the protein subunit.
Figure S4 Time evolution of a crucial dihedral angle common to all the inhibitors bound to hPNP. The dihedral angle analyzed is between the methylene hydroxy that interacts with His257 and the 4′C and 4′O/N/C. For example, the dihedral angle for inosine is defined by 5′O-5′C-4′C-4′O. The dihedral angle for the DAT inhibitor is defined by 3′O- 3′C-4′C-4′N. Fluctuations in the same dihedral angle of SER, IMH, and INO shows the flexibility of the ligands in the active site.
Figure S5 A snapshot of the inosine active site shows the 5′-OH of inosine hydrogen bonding with Thr242.


