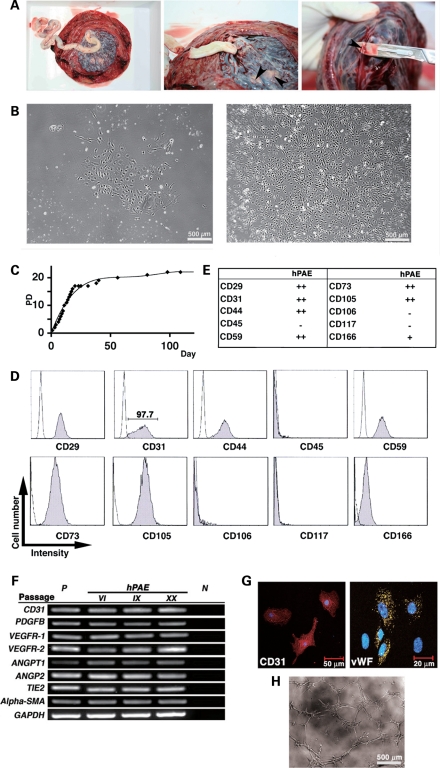
Figure 1.
In vitro characterization of hPAE cells. (A) Macroscopic views showing an explant culture method of hPAE cells. hPAE cells were dissected from isolated placenta arterial vessels (indicated by arrowheads) in human placenta. (B) Photos showing morphology of hPAE cells by phase contrast microscopy at primary stages at passage I (left panel: PD 0 and right panel: PD 3). (C) Proliferative capacity of hPAE cells. The number of cells was counted with ViCell (Beckman Coulter) at each passage. The total number of PDs (PD level or accumulative PDs) was calculated, using the formula log10(total number of cells/starting number of cells)/log10 2. (D) Flow cytometric profiles indicating expression of several cell surface markers on hPAE cells. (E) Scores of peak intensity, compared with isotype controls. ‘++': strongly positive (10 times and above that of the isotype control), ‘+': weakly positive (<10 times and twice and above that of the isotype control), ‘−': negative (less than twice that of the isotype control). (F) RT–PCR analysis for endothelial marker expression in hPAE cells at passage VI, IX and XX. The cells were cultured without any inductive stimuli. RNAs from HUVECs and H2O serve as positive (P) and negative (N) controls, respectively. (G) Immunocytochemical analyses of CD31 and vWF in hPAE cells. (H) Phase contrast micrograph of in vitro endothelial network formation of hPAE cells. hPAE cells were cultured on a basement membrane matrix gel. An ‘angiogenesis network' was formed 6 h after cultivation began.

