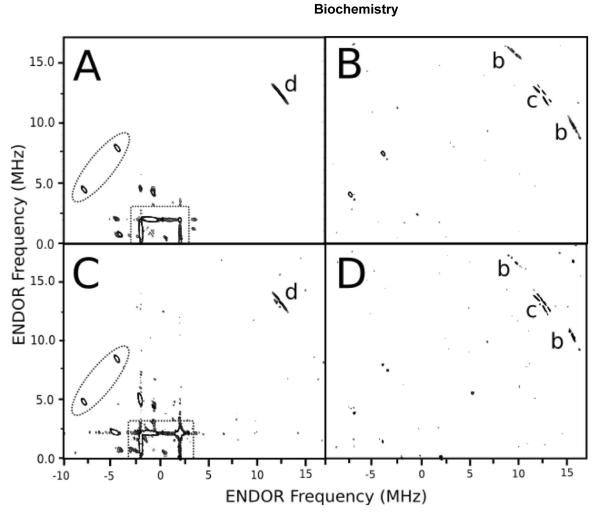
Figure 3. HYSCORE difference spectrum of the R108H mutant (A,B) and CYP2C9 with 100 mM imidazole (C,D), respectively.
The panels on the left (A and C) and right (B and D) are the positive and negative peaks from the HYSCORE difference spectra, respectively. The labeling is the same as in Figure 2, except that a dashed oval covers the peaks around 4.39 and 7.85 MHz, while the dashed box is around the ridges, found at ±1.91 MHz, in the nitrogen frequency region from both panels.

