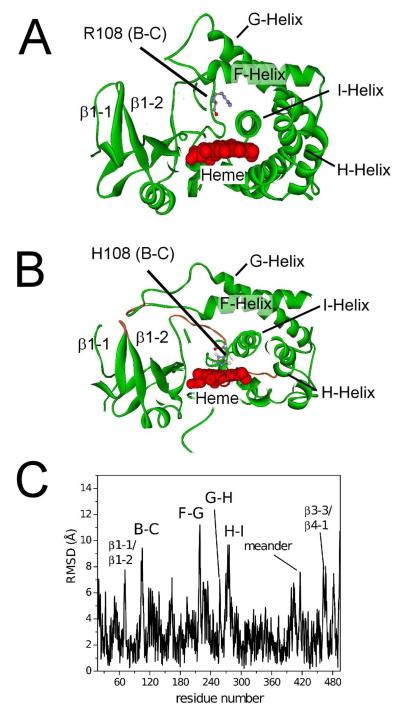
Figure 4. Differences in the energy-minimized structures of CYP2C9 and the R108H mutant.
A) Cross-section of the X-ray crystal structure of CYP2C9 (PDB ID: 1R90 (5)) B) Cross-section of the hypothetical model of the R108H mutant, showing binding of H108 to the heme with secondary structures of highest mobility colored orange and labeled. C) The α-carbon backbone root mean square deviation (RMSD) between CYP2C9 (PDB ID: 1R9O) and the R108H mutant with the loops and the meander region, which had the highest deviations, labeled. For example, the labels B-C, β1-1/β1-2 and meander correspond to the B-C loop, β1-1/β1-2 loop and meander region, respectively.

