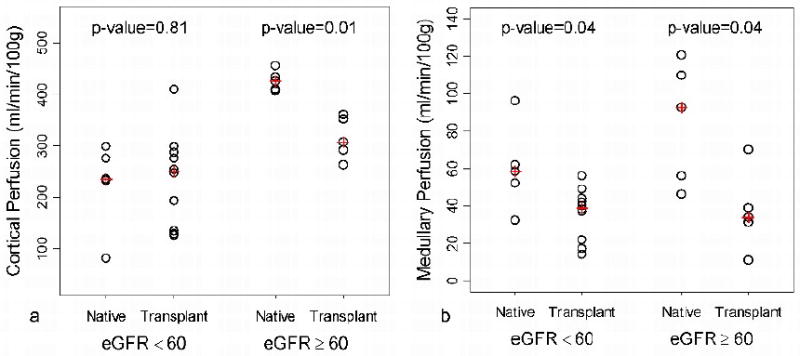
Figure 4.

Groupwise comparison of native and transplant cortical (a) and medullary (b) perfusion separated into two groups based on an eGFR threshold of 60 ml/min/1.73m2. For subjects with eGFR ≥ 60 ml/min/1.73m2, a statistical difference between native and transplant is observed in cortical (p =0.01) and medullary (p = 0.04) perfusion. A statistical difference in medullary perfusion (p = 0.04) was also observed in subjects with eGFR < 60 ml/min/1.73m2. (+: median)
