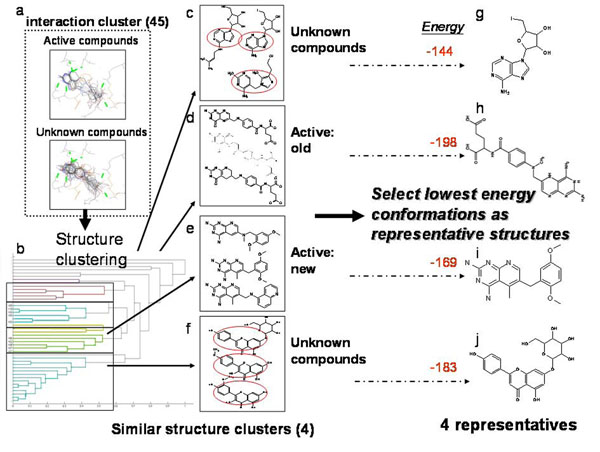
Figure 6.
The process and results of second stage cluster analysis on hDHFR testing dataset. (a) The binding interactions of the largest cluster generated from first stage clustering: 45 compounds include the 10 active compounds and 35 unknown compounds, (b) The result of hierarchical clustering: there were four major clusters identified by the dendrogram (c, d, e, f). The active compounds were spliced into two clusters: (d) the old drugs and (e) the new drugs due to the difference in carboxylic acid groups. The sub-structures from clusters within the red circles in (c) and (f) had similar compounds and the lowest energy compound within each cluster was selected as a final representative (g), (h), (i) and (j).

