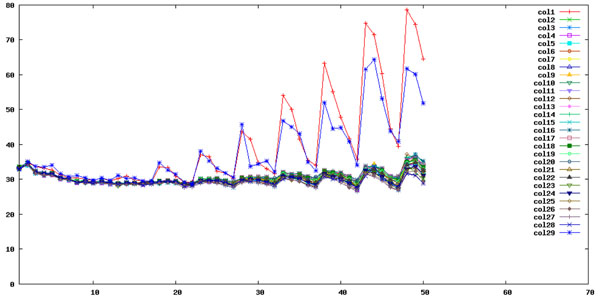
Figure 2.
SOLiD color code bias during the sequencing by ligation process. Each line in Figure 2 represents the fluctuations of SOLiD color code zero for each one of the 29 columns of panels obtained in Figure 1B during the SOLiD sequencing process. The y-axis is the percentage of color code 0 at different sequencing cycles shown on the x-axis.

