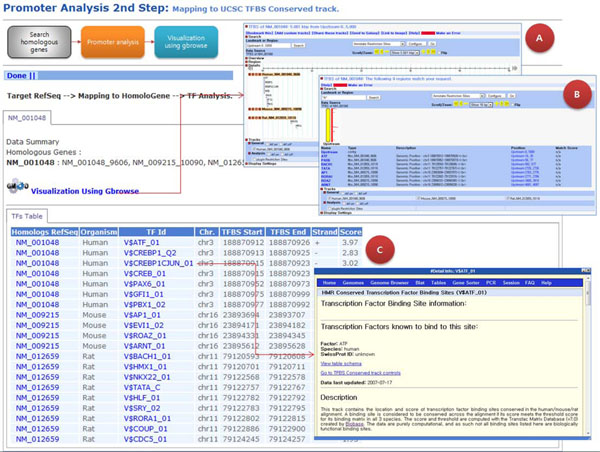
Figure 2.
Comparative transcriptional regulatory network by promoter pipeline. The pipeline provides step-by-step processes with the user’s own data. In the pipeline, a user can obtain information such as A) a visualization of promoter regions, B) a list of TFBS, and C) detailed information about TFBS.

