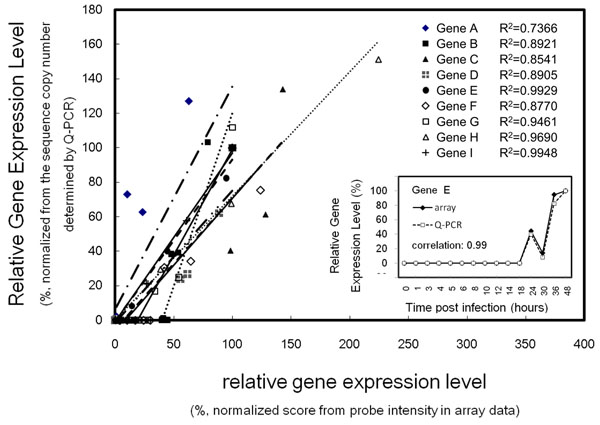
Figure 3.
Validation of the performance of UPS 2.0 designed probes by QPCR. The expression level of nine white spot syndrome virus (WSSV) genes, determined by either QPCR or a microarray, were normalized to the measurement at 48h post viral infection. The coefficients of linear regression of gene-to-probe pairs are >0.7. The gene profile of an example, gene E, is plotted in the insert panel. The normalized measurement by QPCR and the microarray are strongly correlated for gene E (Pearson’s correlation coefficient, 0.99) and all others in this test (data not shown).

