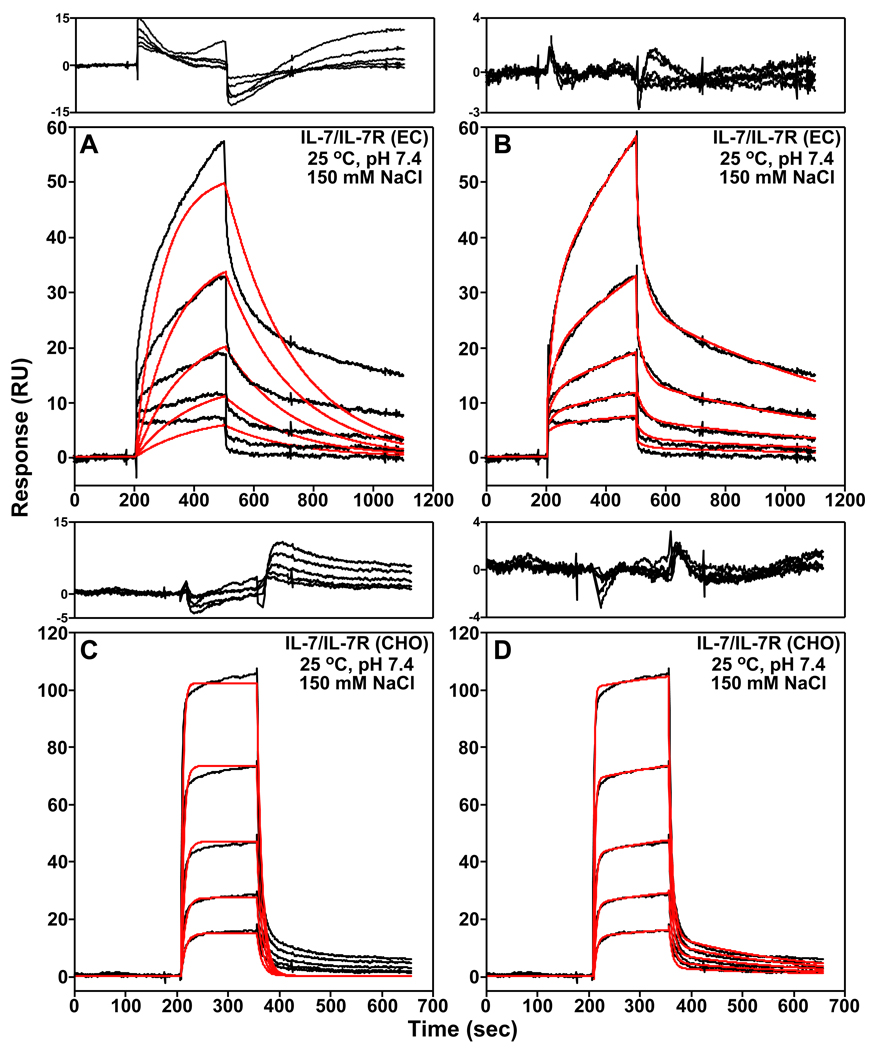
Figure 2.
Examples of the SPR binding kinetics of IL-7 to both nonglycosylated (EC, A and B) and glycosylated (CHO, C and D) forms of the IL-7Rα in 10 mM HEPES (pH 7.4), 150 mM NaCl, 3 mM EDTA, and 0.005% Tween-20 at 298 K. The black curves are trimmed and buffer subtracted binding sensorgrams. Two-fold serial dilutions of IL-7 were performed starting at 2.5 µM for the nonglycosylated IL-7/IL-7Rα (EC) interaction and 100 nM for the glycosylated IL-7/IL-7Rα (CHO) interaction. Also displayed is the global analysis of the sensorgrams analyzed to an one-step (A and C) or a two-step (B and D) binding reaction model using ClampXP (12) and depicted as red curves. The residuals of the global fitting analysis for each binding mechanism are plotted above the sensorgrams. Note that the residual y-axes scales for the two-step binding reactions models are smaller in A and C than the residual y-axes scales for the one-step binding reaction models in B and D.

